ID
30
配置代码
var option = {
tooltip: {
trigger: 'axis'
},
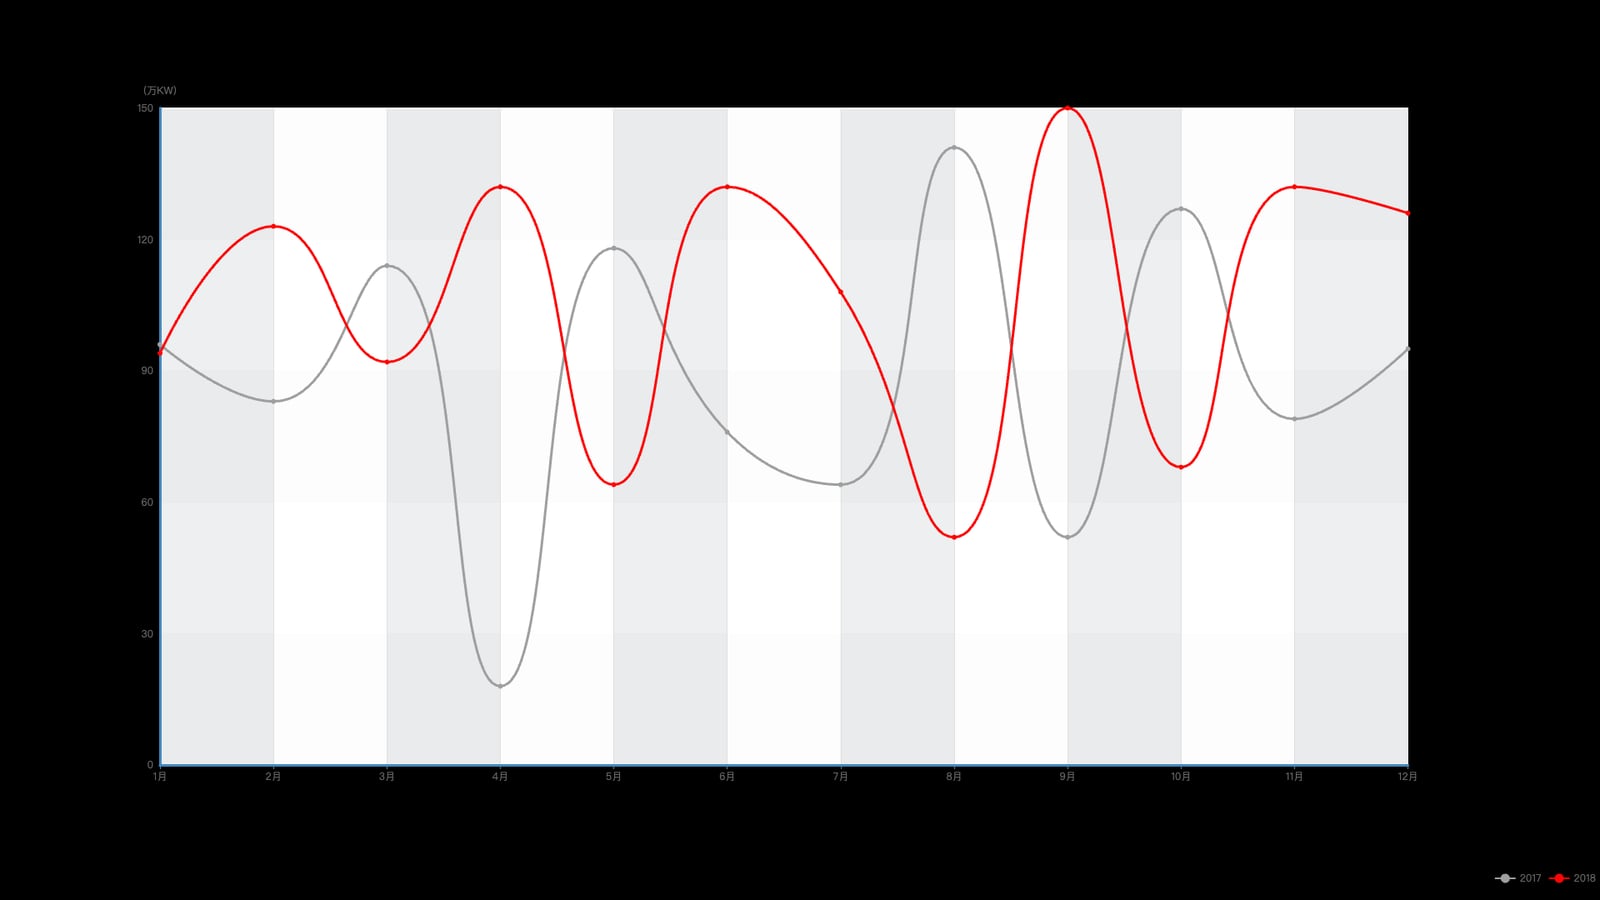
legend: {
data:['2017', '2018'],
left:'right',
textStyle:{
color:'#666',
fontSize:12
}
},
grid : {
left : '10%',
top : '12%',
bottom : '15%',
right: '12%'
},
xAxis: {
type: 'category',
boundaryGap: false,
data: months,
axisLabel: {
show: true,
textStyle: {
color: '#666'
}
},
axisTick: { //刻度值线
show: true
},
splitLine: { //网格线
show: true,
lineStyle: {
color: '#E0E0E0',
width: 1,
type: 'solid'
}
},
axisLine: {
show: true,
lineStyle: {
color: '#4488BB',
width: 3 // 粗细
}
},
splitArea: {
show: true,
areaStyle: {
color: ['rgba(234, 235, 236, 0.8)', 'rgba(255, 255, 255, 0.9)']
}
}
},
yAxis: {
type: 'value',
name: '(万KW)',
nameTextStyle: {
color: '#666',
fontSize: 12
},
axisLabel: {
color: '#666',
formatter: '{value}'
},
axisTick: { //刻度值线
show: false
},
splitLine: { //网格线
show: true,
lineStyle: {
color: '#E0E0E0',
width: 1,
type: 'solid'
}
},
axisLine: {
show: true,
lineStyle: {
color: '#4488BB',
width: 3 // 粗细
}
},
splitArea: {
show: true,
areaStyle: {
color: ["#EAEBEC", "#FFF"]
}
}
},
series: [
{
name: '2017',
smooth: true, //平滑
symbol: 'circle',
symbolSize: 6,
type: 'line',
data: randomData['2017'],
lineStyle: {
width: 3
},
itemStyle: {
color: '#9F9FA0'
}
},
{
name: '2018',
smooth: true,
symbol: 'circle',
symbolSize: 6,
type: 'line',
data: randomData['2018'],
lineStyle: {
width: 3
},
itemStyle: {
color: '#FE0404'
}
}
],
color: ["#9F9FA0","#FE0404"]
};
完整示例代码
相关文件下载地址


