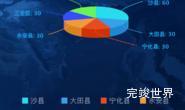
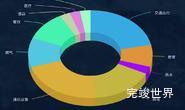
vue2 可视化数据大屏 项目开发中,需要渲染3d饼状图,这里使用的是highcharts来实现的3d饼状图.
安装依赖
npm install highcharts-vue --save
npm install highcharts --save
全局注册
import Vue from 'vue'
import HighchartsVue from 'highcharts-vue'
Vue.use(HighchartsVue)
局部注册
import {Chart} from 'highcharts-vue'
{
    components: {
        highcharts: Chart
    }
}
使用3d
import HighchartsVue from 'highcharts-vue'
Vue.use(HighchartsVue)
import highcharts from 'highcharts'
import highcharts3d from 'highcharts/highcharts-3d'
highcharts3d(highcharts)
完整代码实例
<template>
  <div>
    <highcharts :options="chartOptions" :callback="myCallback"></highcharts>
  </div>
</template>

<script>
import {Chart} from 'highcharts-vue'

export default {
  name: 'HelloWorld',
  components: {
    highcharts: Chart
  },
  data() {
    return {
      chartOptions: {
        chart: {
          type: 'pie',
          backgroundColor: 'rgba(0,0,0,0)',
          options3d: {
            enabled: true,
            alpha: 45
          }
        },
        colors: ['#03B0E7', '#E18E22', '#8E30FF', '#C9B224', '#E0AA12', '#48CBE1', '#51F3A9', '#C3D2A1', '#DC81E5', '#A6FCBD',],
        credits: {
          enabled: false
        },
        title: {
          text: ' '
        },
        subtitle: {
          text: ' '
        },
        plotOptions: {
          pie: {
            innerSize: 100,
            depth: 45,
            dataLabels: {
              style: {
                color: 'rgba(146, 178, 215, 1)'
              }
            },
          }
        },
        series: [{
          name: '功能类别',
          innerSize: '50%',
          data: [
            ['交通出行', 8],
            ['教育', 3],
            ['供水', 1],
            ['供电', 6],
            ['通讯运营', 8],
            ['燃气', 4],
            ['餐饮', 4],
            ['酒店', 1],
            ['医疗', 1],
            ['休闲娱乐', 1]
          ]
        }]
      }
    }
  },
  mounted() {
  },
  methods: {
    myCallback() {
      console.log('this is callback function')
    }
  }
}
</script>

<style>
.highcharts-container {
  width: 100%;
  position: relative;
  height: 100%;
}
</style>