ID
20
配置代码
const option = {
backgroundColor: 'transparent',
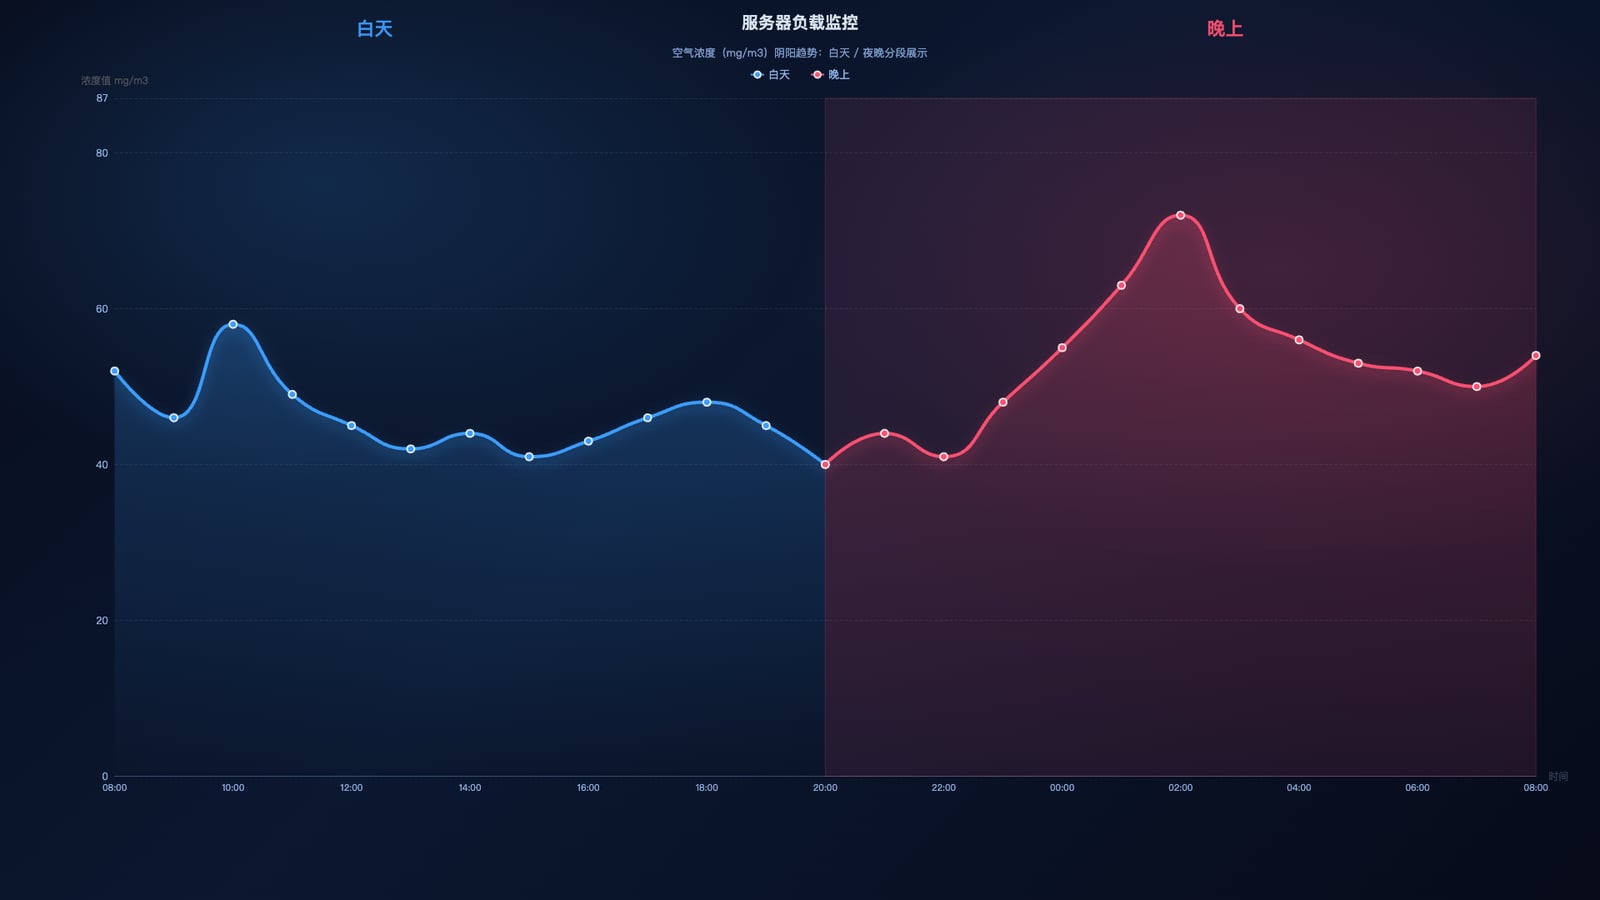
// 双标题:左“白天”右“晚上”
title: [
{
text: '白天',
left: '22%',
top: 18,
textStyle: { color: 'rgba(59,157,252,0.95)', fontSize: 22, fontWeight: 700 }
},
{
text: '晚上',
right: '22%',
top: 18,
textStyle: { color: 'rgba(250,80,113,0.95)', fontSize: 22, fontWeight: 700 }
},
{
text: '服务器负载监控',
left: 'center',
top: 12,
textStyle: { color: 'rgba(230,245,255,0.92)', fontSize: 20, fontWeight: 800 }
},
{
subtext: '空气浓度(mg/m3)阴阳趋势:白天 / 夜晚分段展示',
left: 'center',
top: 42,
subtextStyle: { color: 'rgba(160,200,255,0.75)', fontSize: 13 }
}
], /* ECharts 支持 title 组件为数组,用于多个标题组件 [web:15]. */
legend: {
top: 78,
left: 'center',
data: ['白天', '晚上'],
textStyle: { color: 'rgba(160,200,255,0.9)', fontSize: 13 },
itemWidth: 16,
itemHeight: 10,
itemGap: 24
},
grid: { left: '6%', right: '4%', top: 118, bottom: '12%', containLabel: true },
tooltip: {
trigger: 'axis',
axisPointer: {
type: 'cross',
lineStyle: { color: 'rgba(255,255,255,0.35)', width: 1, type: 'dashed' }
},
backgroundColor: 'rgba(8,16,32,0.92)',
borderColor: 'rgba(255,255,255,0.18)',
borderWidth: 1,
textStyle: { color: '#EAF6FF', fontSize: 13 },
extraCssText: 'box-shadow: 0 10px 30px rgba(0,0,0,0.35); border-radius: 12px;',
formatter: function (params) {
// axis触发时,params是同一类目下各series数据项数组(可能包含null)[web:7].
const time = params?.[0]?.axisValue ?? '';
const pDay = params.find(p => p.seriesName === '白天' && p.value != null);
const pNight = params.find(p => p.seriesName === '晚上' && p.value != null);
const active = pDay || pNight;
if (!active) return `${time}<br/>暂无数据`;
const color = active.seriesName === '白天' ? COLOR_DAY_LINE : COLOR_NIGHT_LINE;
return `
<div style="padding: 12px 14px; min-width: 160px;">
<div style="font-size:14px; color: rgba(160,200,255,0.9); margin-bottom: 6px;">时间:${time}</div>
<div style="display:flex; align-items: baseline; gap: 8px;">
<span style="font-size: 18px; font-weight: 800; color:${color};
完整示例代码
相关文件下载地址


