代码
<template>
<div id="allmap" @mouseover="clearx2" @mouseleave="getmapswitch" class="bodymap"></div>
</template>
<script>
import $ from 'jquery'
import Markericon from './images/Markericon.png'
export default {
data() {
return {
issetInterval: false,
wheight: 0,
value: '全部',
list: [
{
'name': '咖啡',
'value': 1.45
}, {
'name': '硅',
'value': 2.93
}, {
'name': '橡胶',
'value': 3.15
}, {
'name': '蔗糖',
'value': 4.78
}, {
'name': '大米',
'value': 5.93
}, {
'name': '饲料',
'value': 5.73
}, {
'name': '其他',
'value': 5.73
}],
list3: [
{
name: '芒市',
l: 97.884105,
n: 24.008381,
list: [
[97.884105, 24.008381, "芒市豫发服装产业城"],
[97.873182, 23.985932, "国家电子商务进农村综合示范项目"],
[97.866283, 24.03373, "德宏州芒市职业教育中心新建项目"]
]
}, {
name: '瑞丽市',
l: 98.595668,
n: 24.459327,
list: [
[98.595668, 24.459327, "芒市豫发服装产业城"],
[98.595668, 24.479327, "国家电子商务进农村综合示范项目"],
[98.595668, 24.439327, "德宏州芒市职业教育中心新建项目"]
]
}, {
name: '陇川县',
l: 97.847398,
n: 24.182084,
list: [
[97.847398, 24.212084, "芒市豫发服装产业城"],
[97.847398, 24.182084, "国家电子商务进农村综合示范项目"],
[97.847398, 24.142084, "德宏州芒市职业教育中心新建项目"]
]
}, {
name: '梁河县',
l: 98.295086,
n: 24.810259,
list: [
[98.295086, 24.810259, "芒市豫发服装产业城"],
[98.295086, 24.830259, "国家电子商务进农村综合示范项目"],
[98.275086, 24.850259, "德宏州芒市职业教育中心新建项目"]
]
}, {
name: '盈江县',
l: 97.955688,
n: 24.691677,
list: [
[97.955688, 24.671677, "芒市豫发服装产业城"],
[97.955688, 24.651677, "国家电子商务进农村综合示范项目"],
[97.985688, 24.691677, "德宏州芒市职业教育中心新建项目"]
]
},],
active: 0,
show: false,
hover: 0,
activeIndex: 0,
activex: 0,
activex2: 0,
activexmap: 0,
timemap: null,
listmap: [],
map: null,
time2: null,
show1: false,
show2: false,
show3: false,
show4: false,
show5: false,
show6: false,
show7: false,
activeyear: 0,
activeyear2: 0,
}
},
components: {},
created() {
},
mounted() {
this.getmapx()
},
methods: {
echartstj() {
var echartsx = echarts.init(document.getElementById("echartstj"));
var option = {
tooltip: {
trigger: 'axis',
axisPointer: {
type: 'cross',
label: {
backgroundColor: '#6a7985'
}
}
},
legend: {
itemGap: 8,
itemWidth: 8,
data: [
{name: '邮件营销', lineStyle: {width: 8}},
{name: '联盟广告'}
]
},
grid: {
left: '5%',
right: '8%',
bottom: '3%',
top: '10%',
containLabel: true
},
xAxis: [
{
type: 'category',
boundaryGap: false,
data: ['04-27', '04-28', '04-29', '04-30', '05-01', '05-02', '05-03'],
axisLabel: {
show: true,
textStyle: {
color: 'rgba(187, 209, 238, 1)'
}
},
axisLine: {
lineStyle: {
color: 'rgba(35, 72, 124, 1.00)',
width: 1,//这里是为了突出显示加上的
}
},
}
],
yAxis: [
{
type: 'value',
splitLine: {
show: false,
lineStyle: {
type: 'dashed',
color: '#315070',
}
},
axisLabel: {
show: true,
textStyle: {
color: 'rgba(187, 209, 238, 1)'
}
},
axisLine: {
lineStyle: {
color: 'rgba(35, 72, 124, 1.00)',
width: 1,//这里是为了突出显示加上的
}
},
},
],
series: [
{
type: 'line',
stack: '总量',
symbol: 'circle',
symbolSize: 12,
areaStyle: {
color: 'rgba(9, 173, 245, 1.00)',
opacity: 0.2
},
lineStyle: {
color: 'rgba(9, 173, 245, 1.00)',
},
itemStyle: {
color: 'rgba(9, 173, 245, 1.00)',
opacity: 0
},
emphasis: {
focus: 'series',
itemStyle: {
opacity: 1,
borderWidth: 3,
borderColor: '#fff',
shadowColor: 'rgba(0, 0, 0, 0.5)',
shadowBlur: 10
}
},
data: [120, 132, 101, 134, 90, 230, 210]
},
]
};
echartsx.clear();
echartsx.resize();
echartsx.setOption(
option
);
},
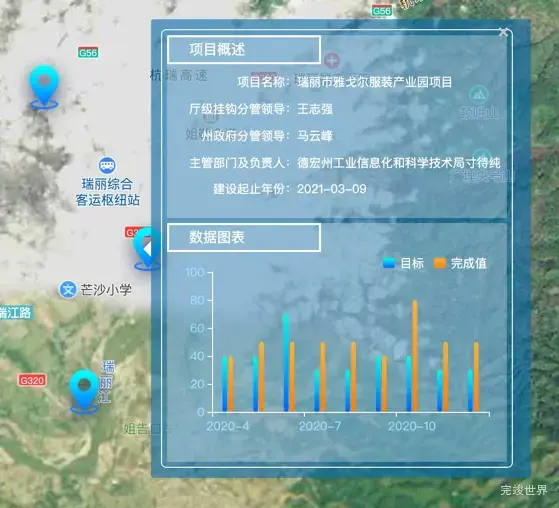
echartsmap() {
var echartsx = this.$echarts.init(document.getElementById("echartsmap"));
var option = {
tooltip: {
trigger: 'axis',
axisPointer: { // 坐标轴指示器,坐标轴触发有效
type: 'shadow' // 默认为直线,可选为:'line' | 'shadow'
}
},
grid: {
left: '4%',
right: '4%',
bottom: '10%',
top: '10%',
containLabel: true
},
legend: {
data: ['目标', '完成值'],
right: 10,
top: 0,
textStyle: {
color: "#fff"
},
itemWidth: 12,
itemHeight: 10,
// itemGap: 35
},
xAxis: {
type: 'category',
data: ['2020-4', '2020-5', '2020-6', '2020-7', '2020-8', '2020-9', '2020-10', '2020-11', '2020-12'],
axisLine: {
lineStyle: {
color: '#fff'
}
},
axisLabel: {
// interval: 0,
// rotate: 40,
textStyle: {
fontFamily: 'Microsoft YaHei',
color: '#98DEFF'
}
},
},
yAxis: {
type: 'value',
max: '100',
axisLine: {
show: true,
lineStyle: {
color: '#fff'
}
},
splitLine: {
show: false,
lineStyle: {
color: 'rgba(255,255,255,0.3)'
}
},
axisLabel: {
textStyle: {
fontFamily: 'Microsoft YaHei',
color: '#98DEFF'
}
}
},
series: [{
name: '目标',
type: 'bar',
barWidth: '15%',
itemStyle: {
normal: {
color: new this.$echarts.graphic.LinearGradient(0, 0, 0, 1, [{
offset: 0,
color: '#00FFEA'
}, {
offset: 1,
color: '#0060FF'
}]),
barBorderRadius: 12,
},
},
data: [40, 40, 70, 30, 30, 40, 40, 30, 30, 30, 40, 40, 30, 30, 30,]
},
{
name: '完成值',
type: 'bar',
barWidth: '15%',
itemStyle: {
normal: {
color: new this.$echarts.graphic.LinearGradient(0, 0, 0, 1, [{
offset: 0,
color: '#F7B237'
}, {
offset: 1,
color: '#FF7C04'
}]),
barBorderRadius: 11,
}
},
data: [40, 50, 50, 50, 50, 40, 80, 50, 50, 50, 70, 50, 50, 50, 50,]
},
]
};
echartsx.clear();
echartsx.resize();
echartsx.setOption(
option
);
},
getactivex2() {
if (this.activex2 < this.list3.length - 1) {
this.activex2 = this.activex2 + 1;
} else {
this.activex2 = 0;
}
},
getactivextime2() {
this.time2 = window.setInterval(() => {
setTimeout(() => {
this.getactivex2()
}, 0)
}, 15000)
},
clearx2() {
clearInterval(this.timemap);
clearInterval(this.time2);
},
getmapswitch() {
this.getmapqh();
this.getactivextime2();
},
getHeight() {
var whei = $(window).width()
$("html").css({fontSize: whei / 22});
this.wheight = $(window).height() - 120;
this.$nextTick(() => {
this.getmapx();
})
},
drawechartmap() {
window.addEventListener('resize', this.drawechartmap)
var myChart = echarts.init(document.getElementById("echartmap"));
var uploadedDataURL = "js/assets/533100.json";
var option = {
tooltip: {
trigger: 'item',
triggerOn: 'click',
showDelay: 0, //浮层显示的延迟
transitionDuration: 0.1, // 提示框浮层的移动动画过渡时间
enterable: true,
formatter: function (params) {
console.log(params)
if (params.data) {
let info = params.data.info || {};
return info
} else {
return
}
},
},
//地理坐标
geo: {
map: 'tjbh',
type: "map",
aspectScale: 0.75, //长宽比
zoom: 1.1,
roam: false,
itemStyle: {
normal: {
areaColor: '#013C62',
shadowColor: 'rgba(10, 31, 167, 1.00)',
shadowOffsetX: 10,
shadowOffsetY: 10,
},
emphasis: {
areaColor: '#2AB8FF',
borderWidth: 0,
color: 'green',
label: {
show: false
}
}
}
},
series: [{
map: 'tjbh', //使用
type: 'map',
label: {
normal: {
show: true,
textStyle: {
color: '#fff'
}
},
emphasis: {
textStyle: {
color: '#fff'
}
}
},
itemStyle: {
normal: {
borderColor: 'rgba(14, 34, 150, 1.00)',
borderWidth: 1,
areaColor: new echarts.graphic.LinearGradient(0, 0, 0, 1, [{
offset: 0, color: 'rgba(0, 214, 246, 1.00)' // 0% 处的颜色
}, {
offset: 0.5, color: 'rgba(0, 214, 246, 1.00)' // 100% 处的颜色
}, {
offset: 1, color: 'rgba(3, 138, 252, 1.00)' // 100% 处的颜色
}]
)
},
emphasis: {
areaColor: new echarts.graphic.LinearGradient(0, 0, 0, 1, [{
offset: 0, color: 'rgba(141, 59, 238, 1.00)' // 0% 处的颜色
}, {
offset: 0.5, color: 'rgba(117, 84, 240, 1.00)' // 100% 处的颜色
}, {
offset: 1, color: 'rgba(115, 86, 241, 1.00)' // 100% 处的颜色
}]
),
borderWidth: 0,
color: 'green'
}
},
zoom: 1.2,
roam: true,
},
//标记 图形 原点 scatter点 effectScatter涟漪特效
{
type: 'scatter',
coordinateSystem: 'geo',
symbolSize: 5,
label: {
normal: {
formatter: '{b}',
position: 'right',
show: true
},
emphasis: {
show: true
}
},
hoverAnimation: true,
itemStyle: {
normal: {
color: '#fff'
}
},
zlevel: 1,
},
]
};
var getData = function () {
$.get(uploadedDataURL, function (geojson) {
echarts.registerMap('tjbh', geojson);
myChart.setOption(option);
})
}
getData()
myChart.on('georoam', function (params) {
var option = myChart.getOption(); //获得option对象
if (params.zoom != null && params.zoom != undefined) { //捕捉到缩放时
option.geo[0].zoom = option.series[0].zoom; //下层geo的缩放等级跟着上层的geo一起改变
option.geo[0].center = option.series[0].center; //下层的geo的中心位置随着上层geo一起改变
} else { //捕捉到拖曳时
option.geo[0].center = option.series[0].center; //下层的geo的中心位置随着上层geo一起改变
}
myChart.dispatchAction({
type: 'restore'
})
myChart.resize();
myChart.setOption(option); //设置option
});
},
drawechart4() {
var chart = Highcharts.chart('container', {
backgroundColor: 'rgba(0,0,0,0)',
colors: ['#44c3ff', '#00d7e9'],
chart: {
type: 'pie',
options3d: {
enabled: true,
alpha: 60,
beta: 0,
depth: 45,
}
},
tooltip: {
pointFormat: '{series.name}: <b>{point.percentage:.1f}%</b>'
},
labels: {
style: {
color: 'red'
}
},
plotOptions: {
pie: {
allowPointSelect: true,
cursor: 'pointer',
depth: 15,
size: '90%',
center: ['38.5%', '48%'],
dataLabels: {
useHTML: true,
enabled: true,
// format: '<div class="dataLabels"><b>{point.name}</b>: {point.percentage:.1f} %</div>',
format: '<div class="dataLabels"><b>{point.name}</b>: {point.percentage:.1f} %</div>',
style: {
color: 'rgba(26, 178, 255, 1)'
}
},
}
},
series: [{
type: 'pie',
name: '接种比例',
data: [
['未接种', 30.8],
['已接种', 30.0]
]
}]
});
},
drawechart7() {
window.addEventListener('resize', this.drawechart7)
var echartsx = echarts.init(document.getElementById("echart7"));
var option = {
tooltip: {
trigger: 'axis',
axisPointer: { // 坐标轴指示器,坐标轴触发有效
type: 'shadow' // 默认为直线,可选为:'line' | 'shadow'
}
},
grid: {
left: '2%',
right: '4%',
bottom: '10%',
top: '20',
containLabel: true
},
legend: {
data: ['目标(%)', '完成情况(%)'],
right: 10,
top: 12,
textStyle: {
color: "#fff"
},
itemWidth: 12,
itemHeight: 10,
// itemGap: 35
},
xAxis: {
type: 'category',
data: ['芒市', '瑞丽', '陇川', '盈江', '梁河'],
axisLine: {
lineStyle: {
color: '#1C2D4C'
}
},
axisLabel: {
// interval: 0,
// rotate: 40,
textStyle: {
fontFamily: 'Microsoft YaHei',
color: '#98DEFF'
}
},
},
yAxis: {
type: 'value',
max: '100',
axisLine: {
show: true,
lineStyle: {
color: '#1C2D4C'
}
},
splitLine: {
show: false,
lineStyle: {
color: 'rgba(255,255,255,0.3)'
}
},
axisLabel: {
textStyle: {
fontFamily: 'Microsoft YaHei',
color: '#98DEFF'
}
}
},
series: [{
name: '目标(%)',
type: 'bar',
barWidth: '15%',
itemStyle: {
normal: {
color: new echarts.graphic.LinearGradient(0, 0, 0, 1, [{
offset: 0,
color: '#00FFEA'
}, {
offset: 1,
color: '#0060FF'
}]),
barBorderRadius: 12,
},
},
data: [40, 40, 30, 30, 30]
},
{
name: '完成情况(%)',
type: 'bar',
barWidth: '15%',
itemStyle: {
normal: {
color: new echarts.graphic.LinearGradient(0, 0, 0, 1, [{
offset: 0,
color: '#F7B237'
}, {
offset: 1,
color: '#FF7C04'
}]),
barBorderRadius: 11,
}
},
data: [40, 50, 50, 50, 50]
},
]
};
var app = {
currentIndex: -1,
};
// if (!this.issetInterval) {
// setInterval(function () {
// this.issetInterval = true;
// var dataLen = option.series[0].data.length;
// // 取消之前高亮的图形
// echartsx.dispatchAction({
// type: 'downplay',
// seriesIndex: 0,
// dataIndex: app.currentIndex
// });
// app.currentIndex = (app.currentIndex + 1) % dataLen;
// echartsx.dispatchAction({
// type: 'highlight',
// seriesIndex: 0,
// dataIndex: app.currentIndex,
// });
// // 显示 tooltip
// echartsx.dispatchAction({
// type: 'showTip',
// seriesIndex: 0,
// dataIndex: app.currentIndex
// });
// }, 1000);
//
// }
echartsx.clear();
echartsx.resize();
echartsx.setOption(
option
);
},
drawechart3() {
window.addEventListener('resize', this.drawechart3)
var echartsx = echarts.init(document.getElementById("cyxxbg"));
let index = 0;
var colorList = ['#73DDFF', '#73ACFF', '#FDD56A', '#FDB36A', '#FD866A', '#9E87FF', '#58D5FF']
var data = this.list;
var option = {
tooltip: {
trigger: 'item'
},
series: [{
type: 'pie',
center: ['25%', '48%'],
radius: ['35%', '60%'],
clockwise: true,
avoidLabelOverlap: true,
hoverOffset: 15,
itemStyle: {
normal: {
color: function (params) {
return colorList[params.dataIndex]
}
}
},
label: {
normal: {
show: false,
position: 'outside',
formatter: '{a|{b}:{d}%}\n{hr|}',
rich: {
hr: {
backgroundColor: 't',
borderRadius: 3,
width: 3,
height: 3,
padding: [3, 3, 0, -12]
},
a: {
padding: [-30, 10, -20, 10]
}
}
},
emphasis: {
show: true,
position: 'outside',
formatter: '{a|{b}:{d}%}\n{hr|}',
rich: {
hr: {
backgroundColor: 't',
borderRadius: 3,
width: 3,
height: 3,
padding: [3, 3, 0, -12]
},
a: {
padding: [-30, 10, -20, 10]
}
}
}
},
labelLine: {
normal: {
length: 20,
length2: 30,
lineStyle: {
width: 1
}
}
},
data: data,
}]
};
echartsx.clear();
echartsx.resize();
echartsx.setOption(
option
);
},
// 高德地图相关
getmapx() {
var that = this;
that.map = new AMap.Map('allmap', {
scrollWheel: true,
viewMode: '2D',
resizeEnable: true,
zoom: 13,
maxZoom: 30,
minZoom: 0,
mapStyle: 'amap://styles/df41fac869f2854d9ea6a987036e8377',
center: [that.list3[that.activex2].l, that.list3[that.activex2].n],
});
var satelliteLayer = new AMap.TileLayer.Satellite();
that.map.add(satelliteLayer);
var data_info = that.list3[that.activex2].list;
for (var i = 0; i < data_info.length; i++) {
that.addMarker(data_info[i][0], data_info[i][1], data_info[i][2], 0)
}
that.getmapqh()
},
markerswitch() {
var that = this;
that.map.setZoomAndCenter(13, [that.list3[that.activex2].list[that.activexmap][0] + 0.03,
that.list3[that.activex2].list[that.activexmap][1]]);
that.map.setZoomAndCenter(13, []);
that.getclear();
var data_info = that.list3[that.activex2].list;
for (var i = 0; i < data_info.length; i++) {
if (that.activexmap === i) {
that.addMarker(data_info[i][0], data_info[i][1], data_info[i][2], 1)
} else {
that.addMarker(data_info[i][0], data_info[i][1], data_info[i][2], 0)
}
}
if (that.activexmap < that.list3[that.activex2].list.length - 1) {
that.activexmap += 1;
} else {
that.activexmap = 0;
}
},
getclear() {
var that = this;
let data = that.map.getAllOverlays();
for (var i = 0; i < data.length; i++) {
that.map.remove(data[i])
}
},
getmapqh() {
var that = this;
clearInterval(this.timemap);
that.timemap = window.setInterval(() => {
setTimeout(() => {
console.log(123)
that.markerswitch();
}, 0)
}, 2000)
},
markerClick(e) {
console.log(e)
var that = this;
that.getclear();
var data_info = that.list3[that.activex2].list;
for (var i = 0; i < data_info.length; i++) {
that.addMarker(data_info[i][0], data_info[i][1], data_info[i][2], 0)
}
var infoWindow = new AMap.InfoWindow({
anchor: 'middle-left',
content: "<div class=\"tanchuangMap\">\n" +
" <div class=\"tanchuangMaptop\"></div>\n" +
" <div class=\"tanchuangMaptop1\">\n" +
" <div class=\"tanchuangMaptop1title\">\n" +
" 项目概述\n" +
" </div>\n" +
" <div class=\"tanchuangMaptop1body\">\n" +
" <p><span>项目名称:</span>瑞丽市</p>\n" +
" <p><span>厅级挂钩分管领导:</span>王志</p>\n" +
" <p><span>州政府分管领导:</span>马云</p>\n" +
" <p><span>主管部门及负责人:</span>德宏州工业</p>\n" +
" <p><span>建设起止年份:</span>2021-03-09</p>\n" +
" </div>\n" +
" </div>\n" +
" <div class=\"tanchuangMaptop1\">\n" +
" <div class=\"tanchuangMaptop1title\">\n" +
" 数据图表\n" +
" </div>\n" +
" <div class=\"tanchuangMaptop1body\">\n" +
" <div class=\"echartsmap\" id=\"echartsmap\">\n" +
" </div>\n" +
" </div>\n" +
" </div>\n" +
" </div>",
});
infoWindow.open(that.map, [e.lnglat.lng, e.lnglat.lat])
setTimeout(() => {
that.echartsmap()
}, 300)
},
addMarker(x, y, title, type) {
var marker = new AMap.Marker({
icon: Markericon,
position: [x, y],
offset: new AMap.Pixel(-13, -30)
});
if (type === 0) {
marker.on('click', this.markerClick)
marker.setMap(this.map);
} else {
marker.on('click', this.markerClick)
var markerContent = document.createElement("div");
var markerImg = document.createElement("img");
markerImg.className = "markerlnglat";
markerImg.src = "images/Markericon.png";
markerContent.appendChild(markerImg);
var markerSpan = document.createElement("span");
markerSpan.className = 'marker';
markerSpan.innerHTML = title;
markerContent.appendChild(markerSpan);
marker.setPosition([x, y]);
marker.setContent(markerContent);
marker.setMap(this.map);
}
},
getactive(index) {
this.active = index;
},
},
filters: {},
watch: {}
}
</script>
<style lang="scss">
.bm-view {
width: 100%;
height: 100%;
position: relative;
}
.bodymap {
width: 100%;
height: 100%;
position: relative;
}
.markerx {
background: #fff;
font-size: 14px;
color: #333;
position: absolute;
width: 130px;
padding: 10px;
border-radius: 10px;
}
.tanchuangMap {
border: 1px solid #fff;
width: 350px;
z-index: 100000;
min-height: 100px;
border-radius: 5px;
.tanchuangMaptop1 {
margin: 5px;
background: rgba(255, 255, 255, 0.3);
min-height: 100px;
.tanchuangMaptop1title {
font-size: 14px;
color: #fff;
border: 2px solid #fff;
height: 25px;
width: 150px;
display: flex;
justify-content: flex-start;
align-items: center;
flex-wrap: nowrap;
flex-direction: row;
text-indent: 20px;
}
.tanchuangMaptop1body {
color: #fff;
font-size: 12px;
padding-bottom: 10px;
p {
margin: 10px 10px;
display: flex;
justify-content: flex-start;
align-items: center;
flex-wrap: nowrap;
flex-direction: row;
width: 100%;
overflow: hidden;
white-space: nowrap;
text-overflow: ellipsis;
span {
width: 120px;
display: flex;
justify-content: flex-end;
align-items: center;
flex-wrap: nowrap;
flex-direction: row;
}
}
}
}
.echartsmap {
width: 330px;
margin: auto;
height: 200px;
}
}
.amap-info-outer, .amap-menu-outer {
background: rgba(6, 106, 171, 0.6) !important;
}
</style>