ID
22
配置代码
const option = {
backgroundColor: 'transparent',
title: {
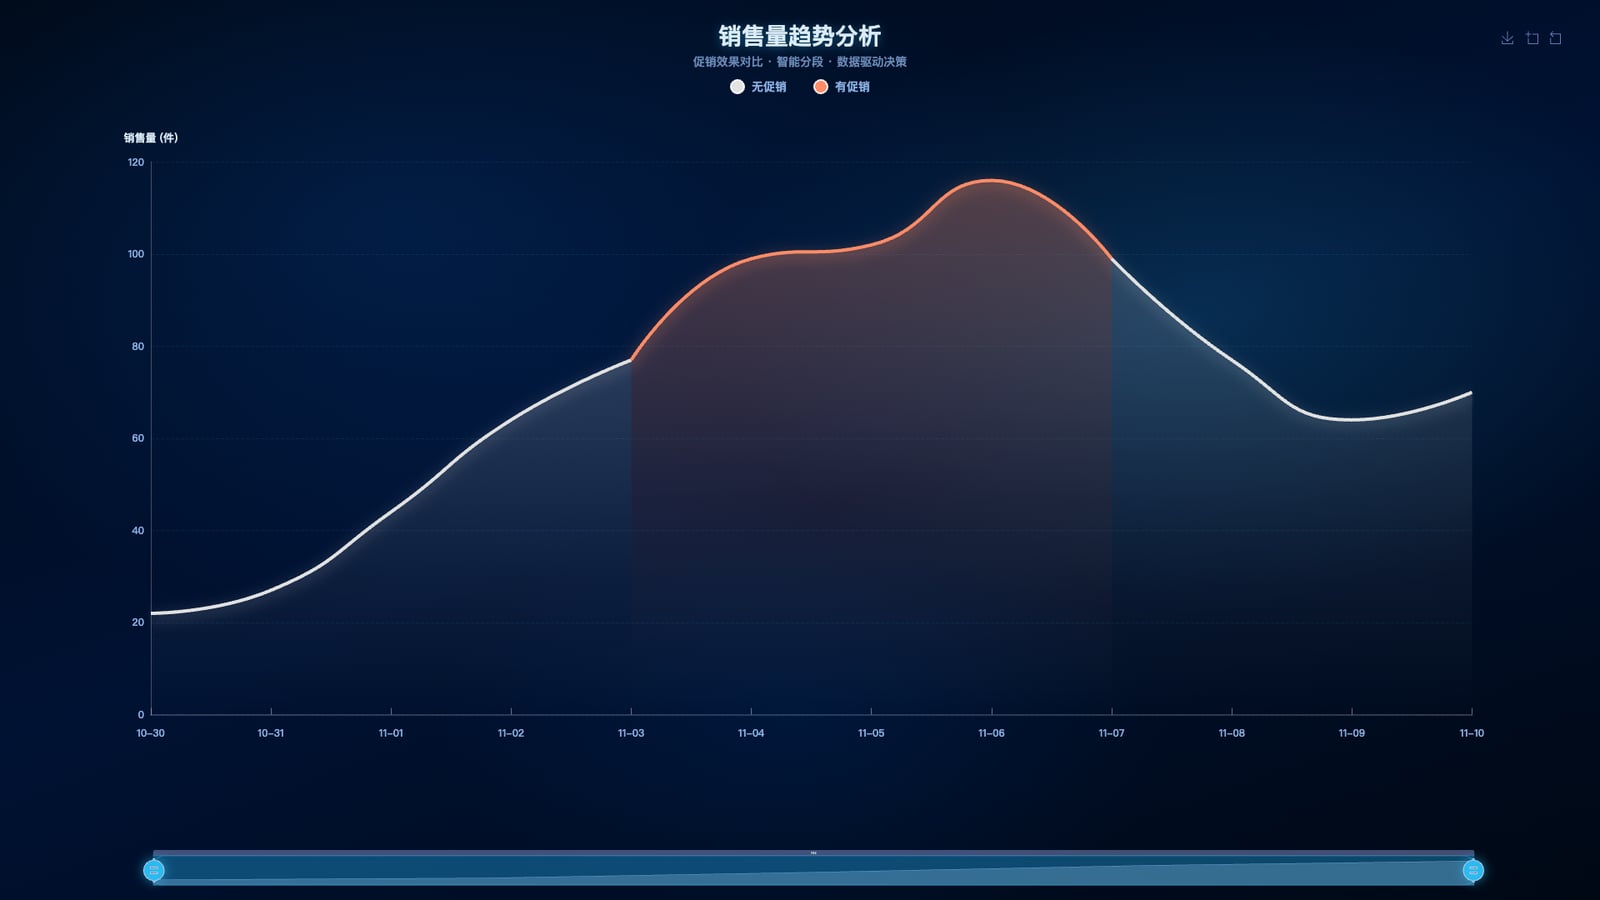
text: '销售量趋势分析',
left: 'center',
top: 24,
textStyle: {
color: THEME.text.primary,
fontSize: 28,
fontWeight: 800,
textShadowColor: 'rgba(43, 187, 239, 0.4)',
textShadowBlur: 12,
textShadowOffsetY: 2
},
subtext: '促销效果对比 · 智能分段 · 数据驱动决策',
subtextStyle: {
color: THEME.text.muted,
fontSize: 14,
fontWeight: 500
}
},
legend: {
data: [
{ name: '无促销', icon: 'circle' },
{ name: '有促销', icon: 'circle' }
],
top: 90,
left: 'center',
itemWidth: 24,
itemHeight: 16,
itemGap: 32,
textStyle: {
color: THEME.text.secondary,
fontSize: 14,
fontWeight: 600
}
},
grid: {
left: '8%',
right: '8%',
top: '18%',
bottom: '18%',
containLabel: true
},
toolbox: {
feature: {
saveAsImage: {
title: '保存为图片',
backgroundColor: THEME.background,
pixelRatio: 3
},
dataZoom: {
title: { zoom: '区域缩放', back: '恢复缩放' }
}
},
right: 30,
top: 20
},
tooltip: {
trigger: 'axis',
backgroundColor: 'transparent',
borderWidth: 0,
padding: 0,
extraCssText: 'box-shadow: none;',
axisPointer: {
type: 'line',
lineStyle: {
color: THEME.secondary,
width: 2,
shadowColor: 'rgba(43, 187, 239, 0.5)',
shadowBlur: 10
},
label: {
backgroundColor: THEME.primary,
borderColor: 'rgba(255, 255, 255, 0.4)',
borderWidth: 1,
color: '#fff',
shadowColor: 'rgba(0, 0, 0, 0.3)',
shadowBlur: 8,
padding: [8, 16],
fontSize: 13,
fontWeight: 700
}
},
formatter: function(params) {
if (!params || !params[0] || !params[0].value) return '暂无数据';
const data = params[0].value;
const date = data[0];
const sales = data[1];
const seriesName = params[0].seriesName;
const isPromo = seriesName === '有促销';
return `
<div class="tooltip-wrapper">
<div style="color: ${THEME.text.muted};
完整示例代码
相关文件下载地址


