ID
23
配置代码
const option = {
backgroundColor: 'transparent',
title: {
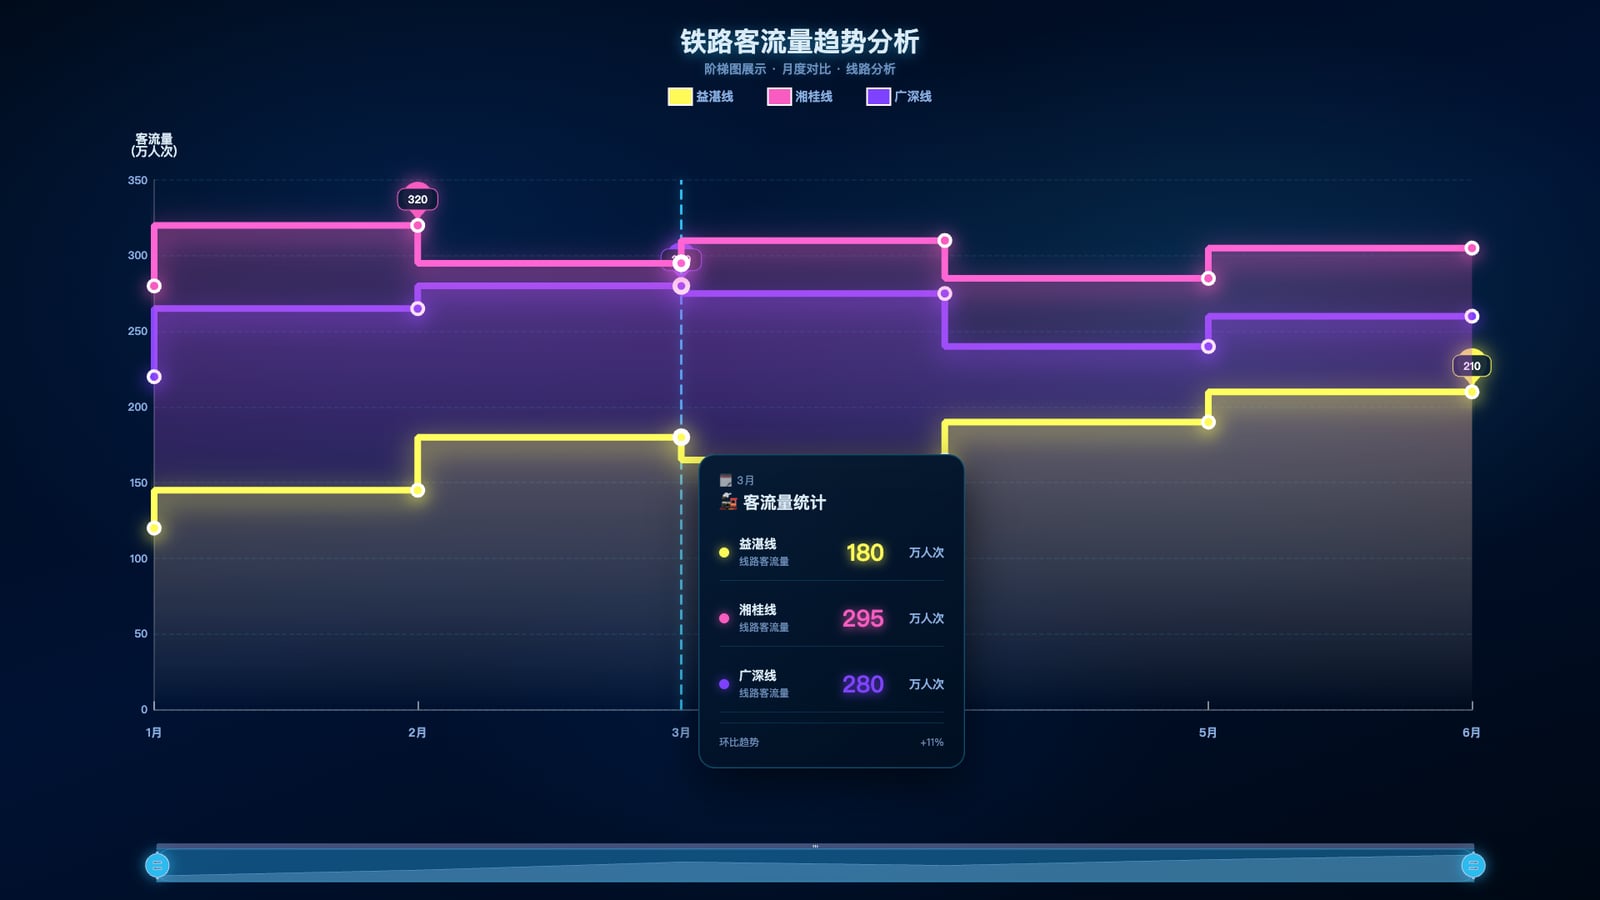
text: '铁路客流量趋势分析',
left: 'center',
top: 28,
textStyle: {
color: THEME.text.primary,
fontSize: 32,
fontWeight: 900,
textShadowColor: 'rgba(43, 187, 239, 0.5)',
textShadowBlur: 16,
textShadowOffsetY: 3
},
subtext: '阶梯图展示 · 月度对比 · 线路分析',
subtextStyle: {
color: THEME.text.muted,
fontSize: 15,
fontWeight: 500,
textShadowColor: 'rgba(43, 187, 239, 0.3)',
textShadowBlur: 8
}
},
legend: {
data: legendData,
top: 100,
left: 'center',
orient: 'horizontal',
itemWidth: 28,
itemHeight: 20,
itemGap: 40,
icon: 'rect',
textStyle: {
color: THEME.text.secondary,
fontSize: 15,
fontWeight: 700
},
emphasis: {
textStyle: {
fontSize: 16,
fontWeight: 800
}
}
},
grid: {
left: '8%',
right: '8%',
top: '20%',
bottom: '18%',
containLabel: true
},
tooltip: {
trigger: 'axis',
backgroundColor: 'transparent',
borderWidth: 0,
padding: 0,
extraCssText: 'box-shadow: none;',
axisPointer: {
type: 'line',
lineStyle: {
color: THEME.secondary,
width: 3,
shadowColor: 'rgba(43, 187, 239, 0.6)',
shadowBlur: 12
},
label: {
backgroundColor: 'rgba(3, 25, 51, 0.95)',
borderColor: 'rgba(43, 187, 239, 0.4)',
borderWidth: 1,
color: THEME.text.primary,
shadowColor: 'rgba(0, 0, 0, 0.4)',
shadowBlur: 10,
padding: [10, 20],
fontSize: 14,
fontWeight: 700
}
},
formatter: function(params) {
if (!params || !params.length) return '';
const month = params[0].axisValue;
let content = `
<div class="tooltip-wrapper">
<div style="color: ${THEME.text.muted};
完整示例代码
相关文件下载地址


