ID
26
配置代码
const option = {
title: {
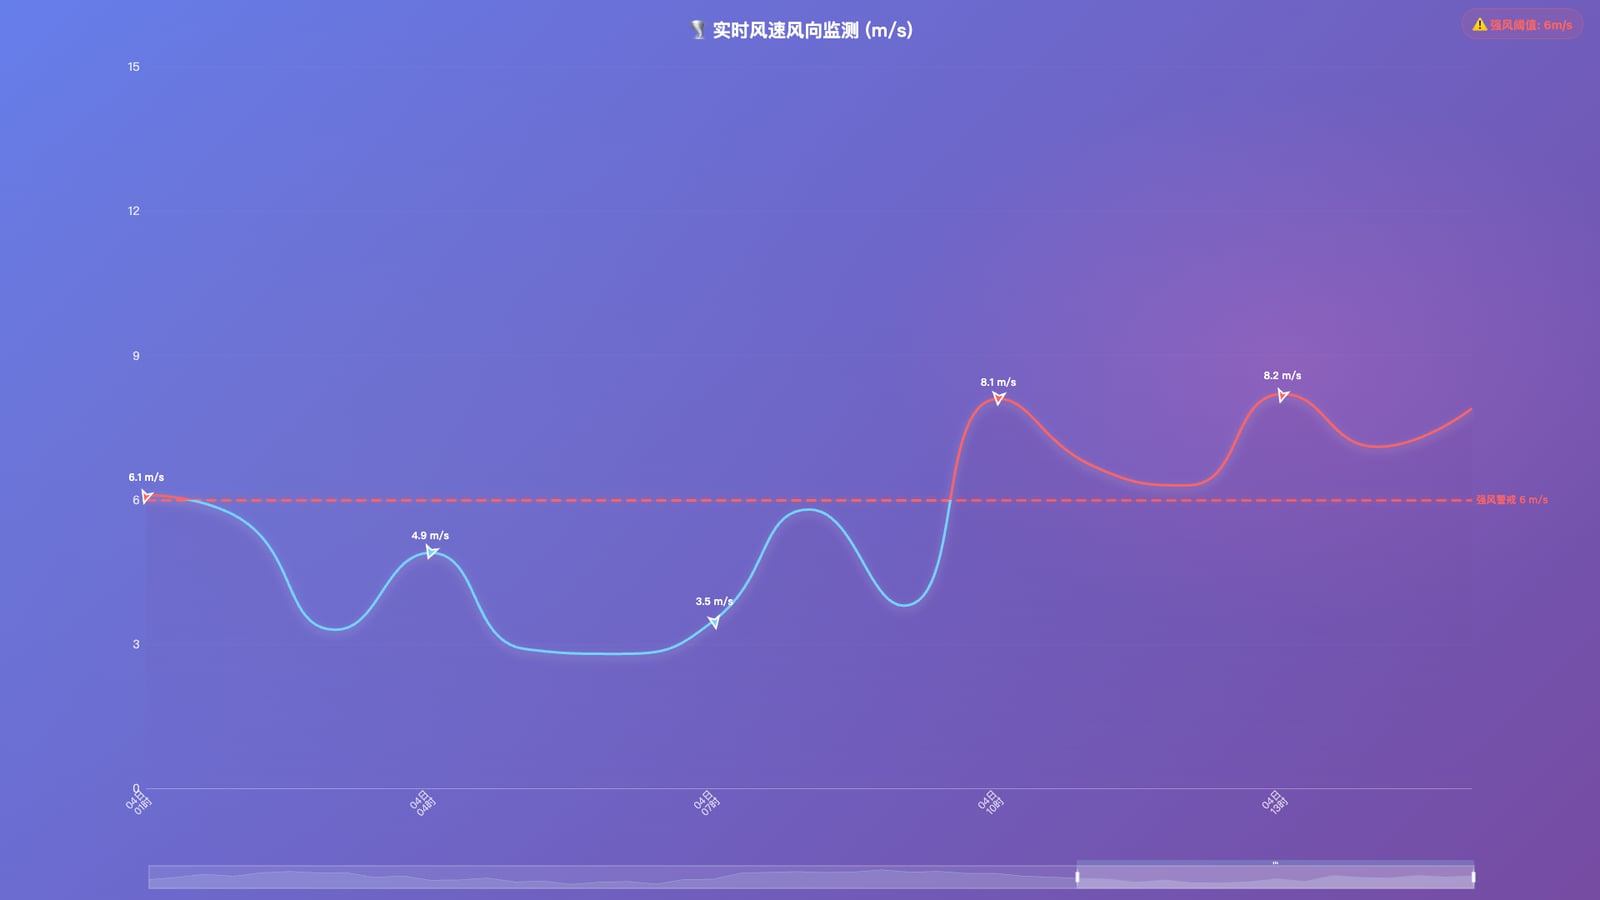
text: '🌪️ 实时风速风向监测 (m/s)',
left: 'center',
top: 20,
textStyle: {
color: '#fff',
fontSize: 22,
fontWeight: 'bold',
shadowColor: 'rgba(255,255,255,0.3)',
shadowBlur: 10
}
},
grid: {
left: '8%',
right: '8%',
top: 80,
bottom: 90,
containLabel: true
},
dataZoom: [{
type: 'slider',
height: 28,
bottom: 20,
start: 60,
end: 100,
backgroundColor: 'rgba(255,255,255,0.1)',
fillerColor: 'rgba(255,255,255,0.2)',
borderColor: 'rgba(255,255,255,0.3)',
handleSize: 20,
textStyle: {
color: '#fff'
}
}, {
type: 'inside',
start: 60,
end: 100
}],
tooltip: {
trigger: 'axis',
axisPointer: {
type: 'cross',
lineStyle: {
color: '#fff',
width: 1,
opacity: 0.7
}
},
backgroundColor: 'transparent',
padding: 0,
formatter: function(params) {
const param = params[0];
const windSpeed = param.value;
const windDir = parseFloat(resdata.windd10[params[0].dataIndex]);
const dirText = getWindDirectionText(windDir);
return `
<div class="tooltip-wrapper">
<div style="color:#fff;font-size:16px;font-weight:bold;margin-bottom:12px;">
🌪️ 风速: <span style="color:#FF6464;font-size:20px;">${windSpeed} m/s</span>
</div>
<div style="color:#fff;font-size:14px;">
🧭 风向: <span class="wind-direction">${dirText}</span> (${windDir}°)
</div>
<div style="color:rgba(255,255,255,0.8);font-size:12px;margin-top:8px;">
📅 时间: ${resdata.date[param.dataIndex]}
</div>
</div>
`;
}
},
xAxis: {
type: 'category',
boundaryGap: false,
axisTick: { show: false },
axisLabel: {
textStyle: { color: 'rgba(255,255,255,0.8)', fontSize: 12 },
rotate: 45,
interval: 2
},
axisLine: {
lineStyle: {
color: 'rgba(255,255,255,0.3)',
width: 1
}
},
data: resdata.date
},
yAxis: {
type: 'value',
splitLine: {
lineStyle: {
color: 'rgba(255,255,255,0.1)',
type: 'dashed',
opacity: 0.5
}
},
axisLine: {
show: false
},
axisLabel: {
textStyle: { color: 'rgba(255,255,255,0.8)', fontSize: 14 }
},
min: minValue,
max: maxValue,
splitNumber: splitNumber,
interval: (maxValue - minValue) / splitNumber
},
visualMap: {
show: false,
pieces: [{
gt: _threshold,
lte: maxValue,
color: '#FF6464' // 强风红色
}, {
value: _threshold,
color: '#FF8C00' // 阈值橙色
}],
outOfRange: { color: '#74D3FF' } // 弱风蓝色
},
series: [{
name: '风速趋势',
type: 'line',
smooth: true,
showAllSymbol: false,
symbol: 'emptyCircle',
symbolSize: 8,
lineStyle: {
width: 3,
shadowColor: 'rgba(255,255,255,0.3)',
shadowBlur: 10,
shadowOffsetY: 4
},
itemStyle: {
borderWidth: 2,
borderColor: '#fff'
},
label: {
show: true,
position: 'top',
fontSize: 12,
color: '#fff',
fontWeight: 'bold',
formatter: '{c} m/s'
},
markLine: {
symbol: ['none', 'none'],
data: [{
name: '强风阈值',
yAxis: _threshold,
lineStyle: {
color: '#FF6464',
width: 3,
type: 'dashed',
shadowColor: 'rgba(255,100,100,0.5)',
shadowBlur: 8
},
label: {
position: 'end',
color: '#FF6464',
fontWeight: 'bold',
formatter: '强风警戒 {c} m/s'
}
}]
},
data: getWindSeries(resdata.winds10, resdata.windd10),
areaStyle: {
color: new echarts.graphic.LinearGradient(0, 0, 0, 1, [
{ offset: 0, color: 'rgba(116, 75, 162, 0.3)' },
{ offset: 0.8, color: 'rgba(116, 75, 162, 0.05)' },
{ offset: 1, color: 'rgba(116, 75, 162, 0)' }
])
},
zlevel: 2
}]
};
完整示例代码
相关文件下载地址


