ID
27
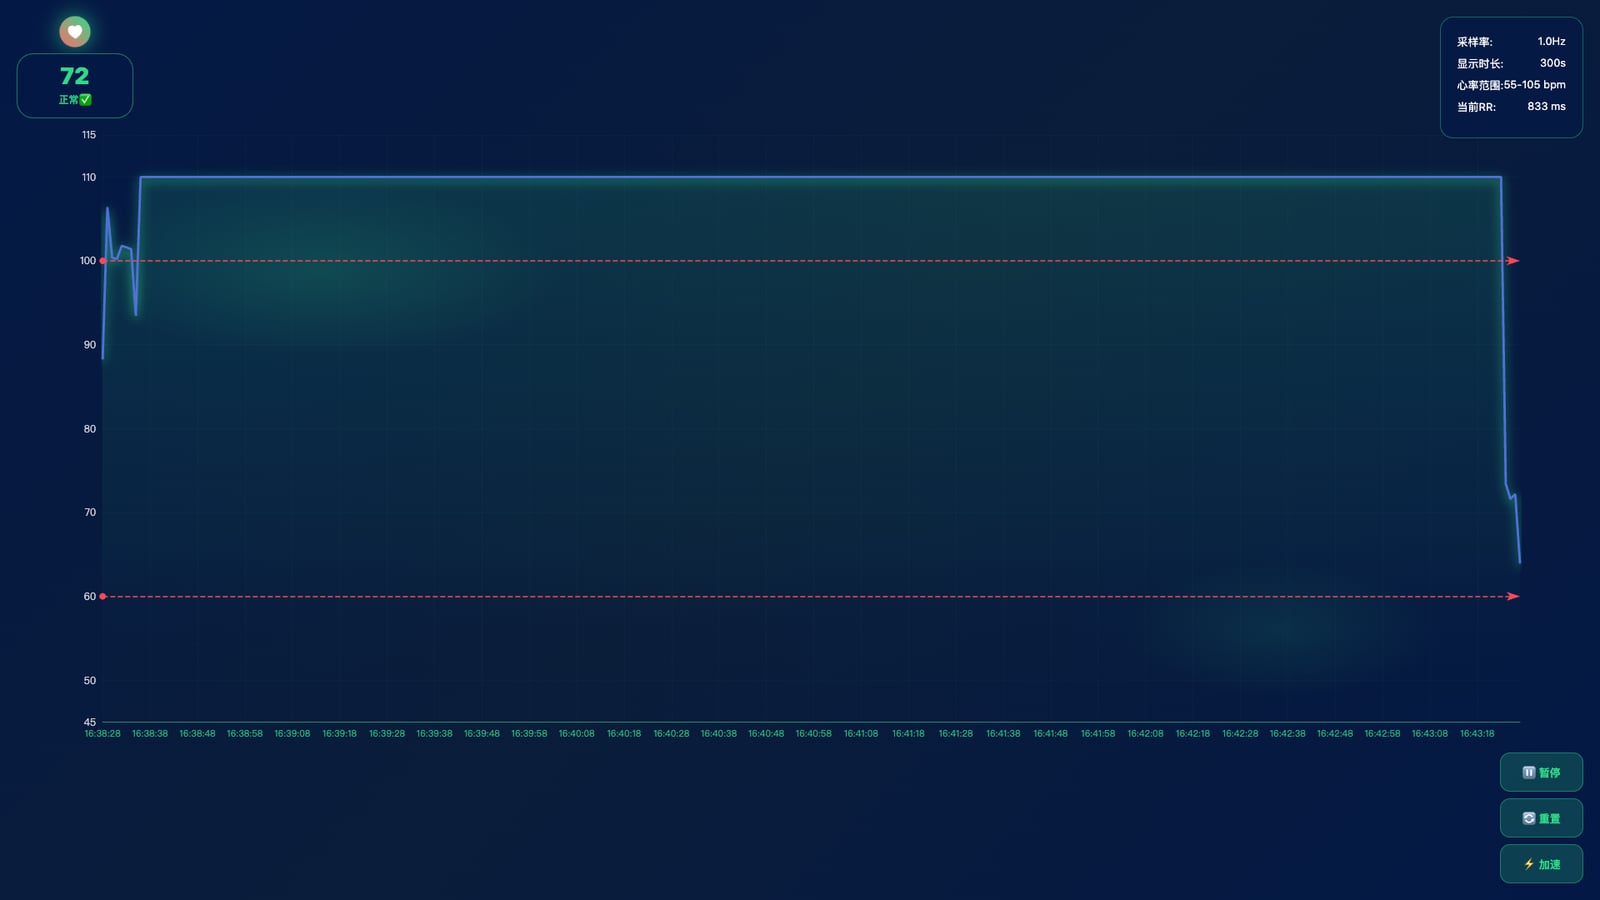
配置代码
const option = {
        backgroundColor: 'transparent',
        tooltip: {
            trigger: 'axis',
            axisPointer: {
                type: 'line',
                lineStyle: { color: '#2DDB89', width: 2, opacity: 0.8 }
            },
            formatter: function(params) {
                const bpm = Math.round(params[0].value || 0);
                const status = getHeartRateStatus(bpm);
                const rr = rrIntervals[rrIntervals.length - 1] || '--';
                return [
                    `<div style="padding:12px 16px;background:rgba(3,24,69,0.95);border:1px solid rgba(45,219,137,0.4);border-radius:10px;font-family:monospace;color:#fff;">`,
                    `<div style="font-size:20px;font-weight:bold;color:#2DDB89;margin-bottom:6px;">❤️ ${bpm} BPM</div>`,
                    `<div style="font-size:13px;">${params[0].name || 'N/A'}</div>`,
                    `<div style="font-size:13px;margin-top:4px;">状态: <span style="color:${status.color}">${status.text}</span></div>`,
                    `<div style="font-size:12px;color:rgba(255,255,255,0.7);">RR间期: ${rr}ms</div>`,
                    `</div>`
                ].join('');
            }
        },
        grid: { left: '5%', right: '5%', top: '15%', bottom: '18%', containLabel: true },
        xAxis: [{
            type: 'category',
            data: date,
            boundaryGap: false,
            axisTick: { show: false },
            axisLabel: {
                color: 'rgba(45,219,137,0.8)',
                fontSize: 11,
                formatter: v => v ? v.slice(-8) : ''
            },
            splitLine: {
                show: true,
                lineStyle: { color: 'rgba(45,219,137,0.1)', width: 0.5, type: 'dashed' }
            },
            axisLine: { lineStyle: { color: 'rgba(45,219,137,0.6)', width: 1 } }
        }],
        yAxis: [{
            type: 'value',
            min: 45,
            max: 115,
            splitNumber: 7,
            axisLabel: { color: 'rgba(255,255,255,0.8)', fontSize: 12 },
            splitLine: {
                show: true,
                lineStyle: { color: 'rgba(45,219,137,0.08)', width: 0.5 }
            },
            axisLine: { lineStyle: { color: 'rgba(45,219,137,0.6)', width: 1 } },
            axisTick: { show: false }
        }],
        series: [{
            name: 'ECG',
            type: 'line',
            data: randomData,
            smooth: false,
            symbol: 'none',
            lineStyle: {
                width: 2.8,
                shadowColor: 'rgba(45,219,137,0.9)',
                shadowBlur: 12,
                shadowOffsetY: 3
            },
            areaStyle: {
                color: new echarts.graphic.LinearGradient(0, 0, 0, 1, [
                    { offset: 0, color: 'rgba(45,219,137,0.2)' },
                    { offset: 0.7, color: 'rgba(45,219,137,0.05)' },
                    { offset: 1, color: 'transparent' }
                ])
            },
            markLine: {
                data: [
                    { yAxis: 60, lineStyle: { color: '#ff4757', width: 1.5, type: 'dashed' }, label: { show: false } },
                    { yAxis: 100, lineStyle: { color: '#ff4757', width: 1.5, type: 'dashed' }, label: { show: false } }
                ]
            }
        }]
    };
完整示例代码
相关文件下载地址


