ID
4
配置代码
const option = {
backgroundColor: '#080b30',
title: {
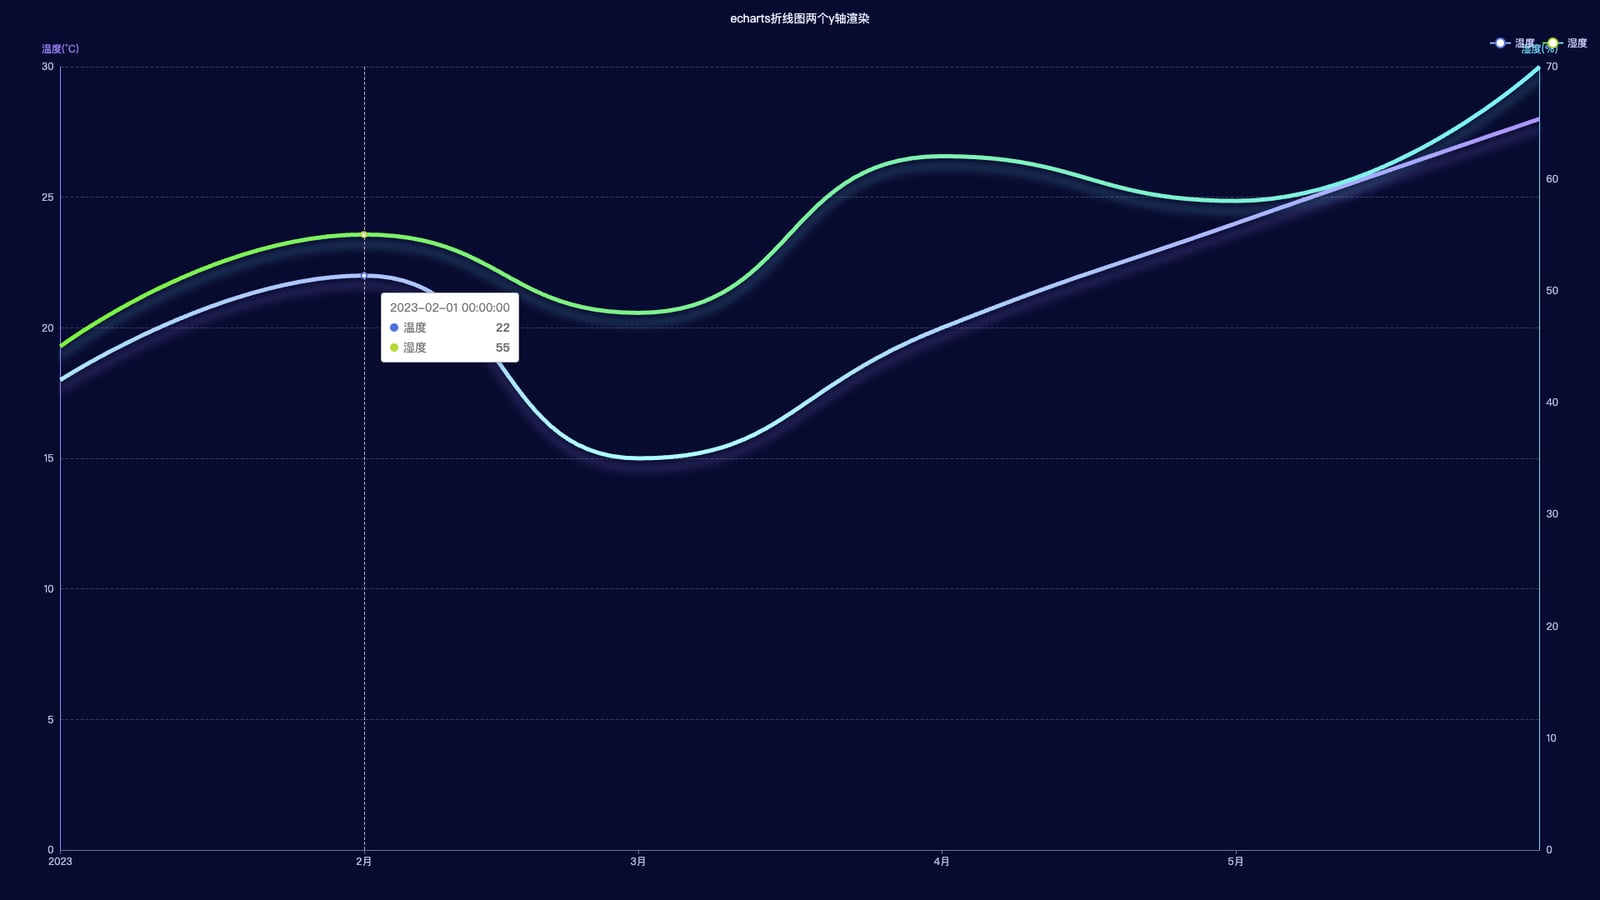
text: 'echarts折线图两个y轴渲染',
left: 'center',
top: 10,
textStyle: {
color: '#E8EEFF',
fontSize: 14,
fontWeight: 400
}
},
legend: {
top: 40,
right: 10,
textStyle: { color: '#C9D1FF' }
},
grid: {
left: 50,
right: 50,
top: 80,
bottom: 40,
containLabel: true
},
tooltip: {
trigger: 'axis',
axisPointer: { type: 'line' }
},
xAxis: {
type: 'time', // 横轴时间轴 [web:3]
axisLine: { lineStyle: { color: '#6B7399' } },
axisLabel: { color: '#B8C0E6' },
splitLine: { show: false }
},
yAxis: [
{
type: 'value',
name: '温度(°C)',
position: 'left',
axisLine: { show: true, lineStyle: { color: '#9E87FF' } },
axisLabel: { color: '#B8C0E6' },
splitLine: { lineStyle: { type: 'dashed', color: 'rgba(220,220,220,0.25)' } }
},
{
type: 'value',
name: '湿度(%)',
position: 'right',
axisLine: { show: true, lineStyle: { color: '#73DDFF' } },
axisLabel: { color: '#B8C0E6' },
splitLine: { show: false }
}
],
series: [
{
name: '温度',
type: 'line',
yAxisIndex: 0, // 绑定左轴 [web:1]
data: tempData,
smooth: true,
showSymbol: false,
lineStyle: {
width: 5,
// 渐变线 [web:7]
color: new echarts.graphic.LinearGradient(0, 1, 0, 0, [
{ offset: 0, color: '#9effff' },
{ offset: 1, color: '#9E87FF' }
]),
// 折线阴影:shadowColor/shadowBlur/shadowOffsetY [web:7]
shadowColor: 'rgba(158,135,255,0.35)',
shadowBlur: 10,
shadowOffsetY: 12
}
},
{
name: '湿度',
type: 'line',
yAxisIndex: 1, // 绑定右轴 [web:1]
data: humData,
smooth: true,
showSymbol: false,
lineStyle: {
width: 5,
color: new echarts.graphic.LinearGradient(0, 0, 1, 0, [
{ offset: 0, color: '#73DD39' },
{ offset: 1, color: '#73DDFF' }
]),
shadowColor: 'rgba(115,221,255,0.35)',
shadowBlur: 10,
shadowOffsetY: 12
}
}
]
};


