echarts 饼状图颜色渐变

echarts yekong 1812℃

wanjunshijie 2021-05-04 at 19.32.15@2x

getecharts() {
            window.addEventListener("resize", function () {
                myChart.resize();
            });
            var myChart = echarts.init(document.getElementById("quezhenryl"));
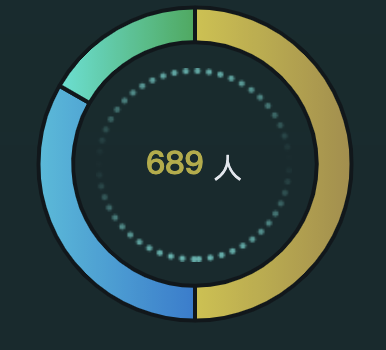
            var getname = ['确诊人员', '疑似人员', '阳性检测人员'];
            var getvalue = [300, 200, 100];
            var data = [];
            for (var i = 0; i < getname.length; i++) {
                data.push({
                    name: getname[i],
                    value: getvalue[i]
                })
            }
            var rich = {
                name: {
                    color: "#FFF",
                    fontSize: 14,
                    padding: [10, 15, 0, 10],
                    fontWeight: '400',
                    align: 'left'
                },
                value: {
                    color: "#FFF",
                    fontSize: 15,
                    padding: [10, 10, 0, 15],
                    fontWeight: '500',
                    align: 'right'
                },
                percent: {
                    color: "#FFF",
                    align: 'right',
                    fontSize: 15,
                    fontWeight: '500',
                    //padding: [0, 5]
                },
                hr: {
                    width: '100%',
                    height: 0,
                },
                cir: {
                    fontSize: 26,
                }
            }
            option = {
                tooltip: {
                    trigger: 'axis',
                },
                series: [{
                    tooltip: {
                        show: false,
                        trigger: 'item',
                        formatter: function (params) {
                            return params.name + ':' + params.value + '册<br>占比:' + params.percent.toFixed(2) + '%'
                        }
                    },
                    itemStyle: {
                        normal: {
                            borderColor: 'rgba(15, 23, 27, 1.00)',
                            borderWidth: 2,
                            color: function (params) {
                                var colorList = [
                                    {
                                        c1: 'rgba(165, 141, 67, 1)',
                                        c2: 'rgba(207, 195, 57, 1)'
                                    },
                                    {
                                        c1: 'rgba(27, 123, 209, 1)',
                                        c2: 'rgba(41, 189, 220, 1)'
                                    },
                                    {
                                        c1: 'rgba(24, 170, 86, 1)',
                                        c2: 'rgba(40, 227, 213, 1)'
                                    }]
                                return new echarts.graphic.LinearGradient(1, 0, 0, 0, [{ //颜色渐变函数 前四个参数分别表示四个位置依次为左、下、右、上
                                    offset: 0,
                                    color: colorList[params.dataIndex].c1
                                }, {
                                    offset: 1,
                                    color: colorList[params.dataIndex].c2
                                }])

                            }
                        }
                    },
                    type: 'pie',
                    radius: ['70%', '90%'],
                    center: ["50%", "50%"],
                    label: {
                        normal: {
                            show: false,
                            position: 'inner',
                            rich: rich,
                        }
                    },
                    data: data
                }
                ]
            };
            myChart.clear();
            myChart.resize();
            myChart.setOption(
                option
            );
        },
喜欢 (2)