echarts饼状图渲染时,需要一个颜色渐变的效果,让饼状图的颜色都沿着顺时针依次渐变,但是在实际开发中,却并没有达到预期的效果。如下图,实际开发中,有的扇形区是顺时针,有的是逆时针,这并不是自己想要的效果。

实际需要
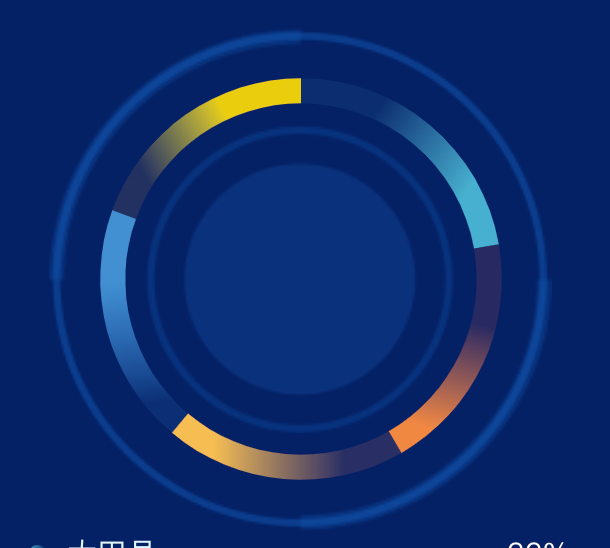
实际上自己想要的是下图顺时针颜色渐变效果。
实现代码
<template>
  <div class="echartsBody">
    <div class="echartsBody1" ref="echarts1"></div>
    <div class="echartsBody2">
    </div>
  </div>
</template>

<script>
import * as echarts from "echarts"

export default {
  name: 'echarts1',
  components: {},
  data() {
    return {}
  },
  props: {
    list: {
      type: Array,
      default() {
        return [];
      }
    },
    title: {
      type: String,
      default() {
        return '建设项目使用林地统计';
      }
    },
    total: {
      type: String,
      default() {
        return 0;
      }
    },
  },
  mounted() {
    var that = this;
    const viewElem = document.body;
    // 监听窗口变化,重绘echarts
    const resizeObserver = new ResizeObserver(() => {
      setTimeout(() => {
        that.drawEcharts();
      }, 300)
    });
    resizeObserver.observe(viewElem);
  },
  computed: {
    colorList: function () {
      var that = this;
      var colorList = [];
      var totalValue = that.list.reduce((sum, item) => sum + item.value, 0);
      var currentAngle = -Math.PI / 2; // 饼图默认从正上方开始绘制,对应的是-90度或者说是-Math.PI/2弧度

      that.list.forEach((type) => {
        var valuePercent = type.value / totalValue;
        var angleSpan = valuePercent * Math.PI * 2; // 扇区所占的角度范围
        var gradientDirection = that.calculateGradientDirection(currentAngle, angleSpan);

        var color = new echarts.graphic.LinearGradient(
            gradientDirection.x0, gradientDirection.y0, gradientDirection.x1, gradientDirection.y1,
            [{
              offset: 0,
              color: type.color2
            }, {
              offset: 1,
              color: type.color1
            }]
        );

        colorList.push(color);
        currentAngle += angleSpan; // 更新当前角度到下一个扇区的起始角度
      });

      return colorList;
    }
  },
  methods: {
    calculateGradientDirection(startAngle, angleSpan) {
      // 这里需要根据扇区的起始角度和角度跨度来计算渐变的(x0, y0)和(x1, y1)
      // 这是一个复杂的数学问题,需要根据饼图的绘制逻辑来计算
      // 以下代码是一个示例,可能需要根据实际情况调整
      var x0 = 0.5 + 0.5 * Math.cos(startAngle);
      var y0 = 0.5 + 0.5 * Math.sin(startAngle);
      var x1 = 0.5 + 0.5 * Math.cos(startAngle + angleSpan);
      var y1 = 0.5 + 0.5 * Math.sin(startAngle + angleSpan);
      return {x0, y0, x1, y1};
    },
    drawEcharts() {
      var that = this
      let myChart = echarts.init(this.$refs.echarts1)
      var colors = this.colorList
      var data = []
      that.list.forEach((type) => {
        if (type.checked) {
          var datas = {
            ...type
          }
          data.push(datas)
        }
      });
      var option = {
        color: colors,
        tooltip: {
          trigger: 'item'
        },
        series: [
          {
            name: '建设项目使用林地统计',
            type: 'pie',
            roundCap: true,
            radius: ['70%', '80%'],
            center: ['50%', '50%'],
            label: {
              show: false,
              normal: {
                show: false,
                fontSize: 14,
                color: '#92B2D7'
              }
            },
            labelLine: {
              show: false,
              length: 1,
              length2: 10
            },
            data: data
          },
        ]
      }
      myChart.clear()
      myChart.resize()
      myChart.setOption(option)
    },
  }
}
</script>

<style lang="scss" scoped>
.echartsBody {
  position: relative;
  width: 50%;
  height: calc(100% - 0px);

  .echartsBody1 {
    position: relative;
    width: 100%;
    height: calc(100% - 0px);
  }

  .echartsBody2 {
    position: absolute;
    top: 0;
    left: 0;
    width: 100%;
    height: calc(100% - 0px);
    display: flex;
    justify-content: center;
    align-items: center;
    flex-wrap: nowrap;
    flex-direction: column;
    align-content: flex-start;
    pointer-events: none;
    background: url("./assets/echartsbg.png") center center no-repeat;
    background-size: contain;

    .echartsTitle {
      font-size: 30px;
      font-family: DIN;
      font-weight: normal;
      color: #FFFFFF;
      text-shadow: 0 0 10px rgba(120, 168, 238, 1.00);
    }

    .echartsDesc {
      font-size: 14px;
      font-family: MicrosoftYaHei;
      font-weight: 400;
      color: #9DB9E9;
    }
  }
}
</style>


