数据可视化大屏项目开发中,echarts柱状图会遇到数据过多展示不全的情况,客户想要实现展示一部分,然后鼠标拖动或者滚轮时,实现数据切换展示。
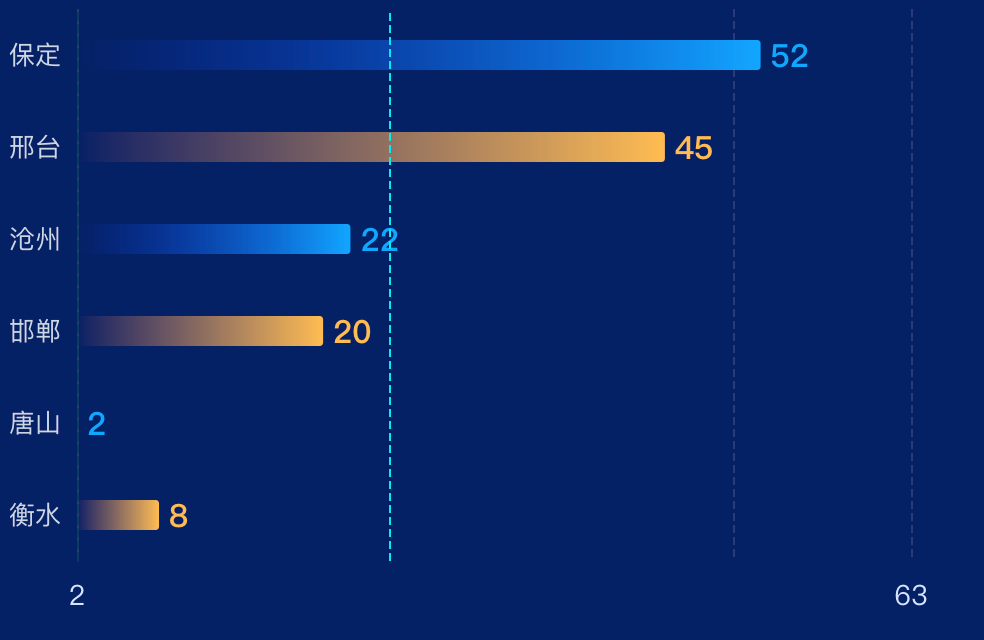
动态效果
关键代码
这里我们使用dataZoom来实现数据展示,将数据进行分组,每组展示5条
dataZoom: [
  {
    type: 'slider',
    yAxisIndex: 0,
    zoomLock: true,
    start: 0,
    show: false,
    end: 100 / (this.list.length / 5),  // 根据数据总数计算每次显示3条数据的比例
    zoomOnMouseWheel: false,
    moveOnMouseWheel: true,
    moveOnMouseMove: true
  },
  {
    type: 'inside',
    yAxisIndex: 0,
    start: 0,
    end: 100 / (this.list.length / 5),  // 根据数据总数计算每次显示3条数据的比例
    zoomOnMouseWheel: false,
    moveOnMouseWheel: true,
    moveOnMouseMove: true
  }
],
完整实例代码
<template>
  <div class="echarts1" ref="echarts">
  </div>
</template>
<script>
import * as echarts from "echarts"

export default {
  name: 'echarts1',
  data() {
    return {}
  },
  props: {
    avg: {
      type: [String, Number],
      default() {
        return 0;
      }
    },
    name: {
      type: [String, Number],
      default() {
        return 0;
      }
    },
    list: {
      type: [Array],
      default() {
        return [];
      }
    },
  },
  watch: {
    list() {
      this.drawEcharts();
    },
  },
  mounted() {
    this.drawEcharts()
  },
  methods: {
    drawEcharts() {
      window.addEventListener('resize', this.drawEcharts)
      // 基于准备好的dom,初始化echarts实例
      let myChart = echarts.init(this.$refs.echarts)
      var list = this.list.map(obj => obj.value)
      let min = Math.min(...list);
      let max = Math.max(...list);
      var option = {
        dataZoom: [
          {
            type: 'slider',
            yAxisIndex: 0,
            zoomLock: true,
            start: 0,
            show: false,
            end: 100 / (this.list.length / 5),  // 根据数据总数计算每次显示3条数据的比例
            zoomOnMouseWheel: false,
            moveOnMouseWheel: true,
            moveOnMouseMove: true
          },
          {
            type: 'inside',
            yAxisIndex: 0,
            start: 0,
            end: 100 / (this.list.length / 5),  // 根据数据总数计算每次显示3条数据的比例
            zoomOnMouseWheel: false,
            moveOnMouseWheel: true,
            moveOnMouseMove: true
          }
        ],
        grid: {
          top: '20px',
          bottom: '20px',
          left: '20px',
          right: '50px',
          containLabel: true
        },
        tooltip: {
          trigger: 'axis',
          show: true,
          backgroundColor: 'rgba(0, 0, 0, 0.8)', // 设置背景色为黑色,透明度为0.9
          borderColor: 'rgba(0, 0, 0, 0.8)', // 设置边线颜色与背景色一致
          textStyle: {
            color: '#ffffff' // 设置文字颜色为白色
          }
        },
        legend: {
          top: 0,
          right: 20,
          show: false,
          itemWidth: 10,
          itemHeight: 10,
          textStyle: {
            color: 'rgba(157, 185, 233, 1)',
            fontSize: '12'
          },
        },
        xAxis: [{
          type: 'value',
          splitNumber: 1,
          min: min,
          max: max,
          axisLabel: {
            margin: 10,
            interval: 0,
            color: 'rgba(211, 229, 255, 1)',
            textStyle: {
              fontSize: 14,
              fontFamily: 'fengguangmingrui',
            },
            formatter: function (value) {
              if (value === min || value === max) {
                return value;
              } else {
                return '';
              }
            }
          },
          axisLine: {
            lineStyle: {
              color: 'rgba(8, 61, 98, 1.00)',
              type: 'dashed',
              width: 1,
            }
          },
          splitLine: {
            show: true,
            lineStyle: {
              color: 'rgba(255, 255, 255, 0.12)',
              width: 1,
              type: 'dashed',
            }
          },
          axisTick: {
            show: false
          },
        }],
        yAxis: [
          {
            type: 'category',
            data: this.list.map(obj => obj.name),
            axisLabel: {
              color: 'rgba(204, 217, 229, 1)',
              textStyle: {
                fontSize: 13,
                fontFamily: 'fengguangmingrui',
              },
              formatter: function (value) {
                return value.length > 5 ? value.slice(0, 5) + '...' : value;
              }
            },
            axisLine: {
              lineStyle: {
                color: 'rgba(8, 61, 98, 1.00)',
                type: 'dashed',
                width: 1,
              }
            },
            axisTick: {
              show: false
            },
            splitLine: {
              show: false,
              lineStyle: {
                color: 'rgba(8, 61, 98, 1.00)',
                type: 'dashed',
                width: 1,
              }
            }
          }],
        series: [
          {
            name: this.name,
            type: 'bar',
            data: this.list.map((obj, index) => {
              return {
                value: obj.value,
                label: {
                  show: true,
                  position: 'right',
                  formatter: '{c}',
                  color: index % 2 === 0 ? 'rgba(18, 167, 255, 1)' : 'rgba(255, 188, 81, 1)', // 根据索引设置标签颜色
                  fontSize: 16,
                  fontFamily: 'D-DIN, D-DIN',
                  fontWeight: 'bold'
                }
              };
            }),
            barWidth: '15',
            itemStyle: {
              normal: {
                color: (params) => {
                  let colorList = [{
                    color1: 'rgba(18, 167, 255, 1)',
                    color2: 'rgba(18, 64, 255, 0)',
                  }, {
                    color1: 'rgba(255, 188, 81, 1)',
                    color2: 'rgba(255, 188, 81, 0)',
                  }];
                  let index = params.dataIndex % colorList.length;
                  return new echarts.graphic.LinearGradient(0, 0, 1, 0, [{
                    offset: 0,
                    color: colorList[index].color2
                  }, {
                    offset: 1,
                    color: colorList[index].color1
                  }], false);
                },
                barBorderRadius: [0, 2, 2, 0] // 设置柱状图圆角
              }
            },
            markLine: {
              symbol: 'none', // 移除箭头
              data: [
                {type: 'average', name: '平均值', value: this.avg}
              ],
              lineStyle: {
                color: 'rgba(0, 237, 244, 1)', // 设置颜色
                type: 'dashed' // 设置为虚线
              },
              label: {
                show: false
              },
            }
          }
        ]
      }
      myChart.clear()
      myChart.resize()
      myChart.setOption(option)
    },
  }
}
</script>

<style lang="scss" scoped>
.echarts1 {
  position: relative;
  width: 100%;
  height: calc(100% - 0px);
}
</style>


