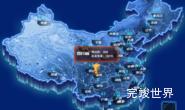
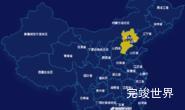
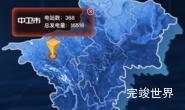
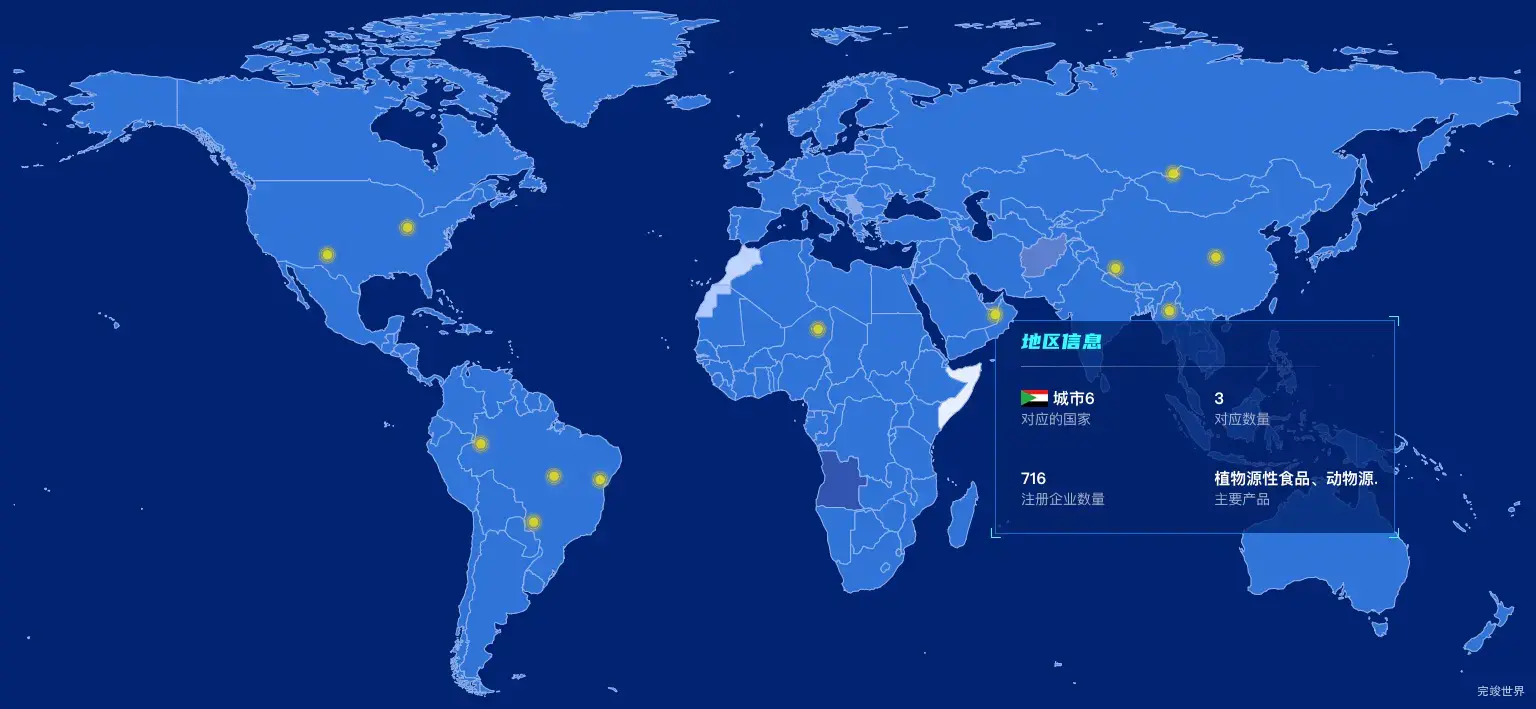
效果:
渲染世界地图,需要世界地图geoJson
并在世界地图上对应的位置添加点,因为并没有提供固定坐标,只是设计图上标注了一些点位,所以这里我们通过给echarts添加点击事件,点击地图后获取经纬度然后将经纬度以scatter方式添加到地图中设置这些圆点。
点击圆点显示弹窗
弹窗我们通过div的方式实现,并通过相对定位的方式定位到地图上,当我们点击圆点的时候,获取鼠标的位置,并赋值给div实现相对定位。
因为只需要点击圆点显示弹窗,所以我们需要对点击事件进行过滤,只有当点击事件是点击在scatter后事件才会生效。
点击获取经纬度
myChart.on('click', function (params) {
        console.log(params)
        let data = myChart.convertFromPixel('geo', [params.event.event.offsetX, params.event.event.offsetY])
        console.log(JSON.stringify(data))
      })
过滤点击事件
当params.componentSubType == 'scatter'才会显示弹窗。
if (params.componentSubType == 'scatter') {
  that.left = params.event.event.offsetX
  that.top = params.event.event.offsetY
  // 获取城市名称 list下的name值
  that.name = params.data.name
  that.show = true
}
效果演示
代码实例
<template>
  <div class="item1">
    <div class="centerMap2">
      <item :item="item" v-for="(item,index) in list" :key="index"></item>
    </div>
    <div class="centerMap" ref="centerMap">
    </div>
    <div class="map">
    </div>
    <div class="popWin" v-if="show" :style="{left:left+'px',top:top+'px'}">
      <div class="popWins">
        <div class="titleInfos">
          <p class="cityName">地区信息</p>
        </div>
        <div class="popLine">
        </div>
        <div class="infoBody">
          <div class="infoItem">
            <div class="infoItemTitle">
              <img src="../assets/sudan.png" alt="">
              <span>{{name}}</span>
            </div>
            <div class="infoItemDesc">对应的国家</div>
          </div>
          <div class="infoItem">
            <div class="infoItemTitle">3</div>
            <div class="infoItemDesc">对应数量</div>
          </div>
          <div class="infoItem">
            <div class="infoItemTitle">716</div>
            <div class="infoItemDesc">注册企业数量</div>
          </div>
          <div class="infoItem">
            <div class="infoItemTitle">植物源性食品、动物源...</div>
            <div class="infoItemDesc">主要产品</div>
          </div>
        </div>
      </div>
    </div>
  </div>
</template>

<script>

import data from '../assets/data.json'
import * as echarts from "echarts"
import icon1 from '../assets/quan.png'

export default {
  name: "item1",
  data() {
    return {
      data,
      height: 0,
      width: 0,
      popShow: false,
      left: 0,
      top: 0,
      show: false,
      name: '',
      num: 10,
      iconData: [{
        "value": [18.19587331845571, 21.323973544869474],
        "id": 0,
        "name": '城市',
        "num": 100
      }, {
        "value": [144.915812991523, 68.45248732129168],
        "id": 0,
        "name": '城市2',
        "num": 100
      }, {
        "value": [160.13528193583818, 43.14184765274008],
        "id": 0,
        "name": '城市3',
        "num": 100
      }, {
        "value": [124.40261571875033, 39.7670956969332],
        "id": 0,
        "name": '城市4',
        "num": 100
      }, {
        "value": [143.59238090940858, 26.830546533006824],
        "id": 0,
        "name": '城市5',
        "num": 100
      }, {
        "value": [81.39107305003347, 25.705629214404524],
        "id": 0,
        "name": '城市6',
        "num": 100
      }, {
        "value": [-59.55444369514646, -24.353191463397536],
        "id": 0,
        "name": '城市7',
        "num": 100
      }, {
        "value": [-75.97757979712378, -23.304630022374738],
        "id": 0,
        "name": '城市8',
        "num": 100
      }, {
        "value": [-102.11386724733433, -13.48832703265714],
        "id": 0,
        "name": '城市9',
        "num": 100
      }, {
        "value": [-83.27142745764763, -37.25411321828926],
        "id": 0,
        "name": '城市9',
        "num": 100
      }, {
        "value": [-156.81772470126344, 43.85954832832479],
        "id": 0,
        "name": '城市10',
        "num": 100
      }, {
        "value": [-128.25015469754493, 52.12590874071857],
        "id": 0,
        "name": '城市11',
        "num": 100
      }],
      list: []
    }
  },
  components: {},
  watch: {},
  mounted() {
    var that = this;
    const viewElem = document.body;
    // 监听窗口变化,重绘echarts
    const resizeObserver = new ResizeObserver(() => {
      setTimeout(() => {
        that.drawEcharts();
      }, 300)
    });
    resizeObserver.observe(viewElem);
  },

  methods: {
    drawEcharts() {
      var that = this;
      var chartDom = that.$refs.centerMap;
      var myChart = echarts.init(chartDom);
      myChart.clear()
      myChart.resize()
      var nameMap = '地图数据';
      var geoCoordMap = {};
      var mapData = [];
      // 图标数据
      echarts.registerMap(nameMap, this.data);
      var mapFeatures = echarts.getMap(nameMap).geoJson.features;
      myChart.hideLoading();
      var mapName = ''
      var serverdata = [{ // 地图块的相关信息
        type: 'map',
        name: '准入审核',
        map: nameMap,
        // zoom: 1.2,
        aspectScale: 0.85,
        z: 10,
        layoutCenter: ["50%", "50%"],
        layoutSize: '200%',
        itemStyle: {
          normal: {
            borderColor: '#93b3ea',
            borderWidth: 1,
            areaColor: '#2f73d9'
          },
          emphasis: {
            areaColor: '#416ef8',
            borderWidth: 0,
            label: {
              show: true,
              color: '#fff'
            },
          }
        },
        select: {
          label: {
            show: true,
            color: '#fff',
            normal: {
              show: true,
              textStyle: {
                fontSize: 14,
                fontWeight: 400,
                color: '#fff'
              }
            },
            emphasis: {
              textStyle: {
                fontSize: 14,
                fontWeight: 400,
                color: '#fff'
              }
            }
          },
          itemStyle: {
            areaColor: '#416ef8',
            borderWidth: 0,
          }
        },
        label: {
          show: false,
          normal: {
            show: false,
            textStyle: {
              fontSize: 14,
              fontWeight: 400,
              color: '#fff'
            }
          },
          emphasis: {
            show: false,
            textStyle: {
              fontSize: 14,
              fontWeight: 400,
              color: '#fff'
            }
          }
        },
        data: mapData
      }]

      mapFeatures.forEach(function (v, index) {
        // 地区名称
        mapData.push({
          name: v.properties.name,
          value: 10 * index
        });
        geoCoordMap[v.properties.name] = v.properties.center;
        mapName = mapName + (mapName ? ',' : '') + v.properties.name

      });
      that.iconData.forEach((type, index) => {
        var datamap = {
          type: 'scatter',
          tooltip: {
            show: true,
            formatter: function (params) {
              return params.data.name;
            }
          },
          name: type.name,
          coordinateSystem: 'geo',
          symbol: 'image://' + icon1,
          symbolSize: [26, 26],
          symbolOffset: [-0, -0],
          hoverAnimation: true,
          z: 101,
          data: [type]
        }
        serverdata.push(datamap)
      });
      var optionMap = {
        visualMap: [{
          min: 0,
          max: 100,
          show: false,
          right: 20,
          bottom: 0,
          realtime: true,
          calculable: true,
          seriesIndex: [0],
          inRange: {
            color: ['#e6edff', '#a8c3ff', '#12389b', '#2f73d9']
          }
        }],
        geo: {
          map: nameMap,
          show: false,
          aspectScale: 0.85,
          layoutCenter: ["50%", "50%"],
          layoutSize: '134%',
          roam: false,
          itemStyle: {
            normal: {
              areaColor: '#3391f8',
              shadowColor: '#3391f8',
              shadowBlur: 1,
              shadowOffsetX: 0,
              shadowOffsetY: 8,
            }
          },
          z: 0,
          label: {
            normal: {
              show: false
            },
            emphasis: {
              show: false
            }
          }
        },
        series: serverdata
      };
      myChart.clear()
      myChart.resize()
      myChart.setOption(optionMap);
      myChart.off('click')
      myChart.on('click', function (params) {
        console.log(params)
        let data = myChart.convertFromPixel('geo', [params.event.event.offsetX, params.event.event.offsetY])
        console.log(JSON.stringify(data))
        that.left = params.event.event.offsetX
        that.top = params.event.event.offsetY
        // 获取城市名称 list下的name值
        that.name = params.data.name
        that.show = true
      })
      // myChart.on('mouseover', function (params) {
      //   that.show = true
      //   that.name = params.name
      // })
      // myChart.on('mouseout', function (params) {
      //   that.show = false
      // })
    }
  },
}
</script>

<style lang="scss" scoped>
.item1 {
  position: relative;
  width: 100%;
  height: 100%;
  display: flex;
  justify-content: center;
  align-items: center;
  flex-wrap: nowrap;
  flex-direction: row;
  align-content: flex-start;
}

.map {
  //background: url("../../../../../assets/centerMap.png") center center no-repeat;
  //background-size: 1024px 783px;
  width: 100%;
  height: 100%;
  display: flex;
  justify-content: center;
  align-items: center;
  flex-wrap: nowrap;
  flex-direction: row;
  align-content: flex-start;
  margin: 0 auto;
  position: absolute;
  z-index: 0;

  img {
    height: 100%;
    max-width: 100%;
    max-height: 100%;
  }
}

.centerMap {
  width: 100%;
  height: 100%;
  position: relative;
  z-index: 1;
  top: 0;
}

.centerMap2 {
  width: 100%;
  height: 100%;
  position: absolute;
  z-index: 13;
  top: 0;
  pointer-events: none;
}

.popWin {
  position: absolute;
  left: 0;
  top: 0;
  background: url("../assets/popBg.png") no-repeat;
  background-size: 100% 100%;
  width: 408px;
  height: 222px;
  z-index: 100;

  .popLine {
    width: 340px;
    height: 1px;
    background: linear-gradient(90deg, #FFFFFF 0%, rgba(255, 255, 255, 0) 100%);
    opacity: 0.3;
    margin-left: 30px;
  }

  .titleInfos {
    margin-left: 30px;
    font-size: 22px;
    font-family: YouSheBiaoTiHei;
    font-weight: 400;
    color: #00FDFE;
    height: 50px;
    display: flex;
    justify-content: flex-start;
    align-items: center;
    flex-wrap: nowrap;
    flex-direction: row;
    align-content: flex-start;
  }
}

.infoBody {
  display: flex;
  justify-content: flex-start;
  align-items: flex-start;
  flex-wrap: wrap;
  flex-direction: row;
  align-content: flex-start;
  width: 100%;

  .infoItem {
    display: flex;
    justify-content: flex-start;
    align-items: flex-start;
    flex-wrap: nowrap;
    flex-direction: column;
    align-content: flex-start;
    margin-left: 30px;
    width: 40%;
    height: 80px;

    .infoItemTitle {
      display: flex;
      justify-content: flex-start;
      align-items: center;
      flex-wrap: nowrap;
      flex-direction: row;
      margin-top: 20px;
      align-content: flex-start;
      font-size: 16px;
      font-family: MicrosoftYaHei;
      font-weight: bold;
      color: #FFFFFF;
      width: 100%;
      overflow: hidden;
      white-space: nowrap;
      text-overflow: ellipsis;

      img {
        margin-right: 5px;
      }
    }

    .infoItemDesc {
      font-size: 14px;
      font-family: MicrosoftYaHei;
      font-weight: 400;
      color: #FFFFFF;
      opacity: 0.6;
    }
  }
}
</style>