vue 数据可视化大屏 项目开发中,设计师设计的地图很漂亮,但是前端实现不了这种效果,这时候我们可以通过一个折中的办法来实现这种效果,以图片做地图以echarts做数据支持完成我们想要的效果。
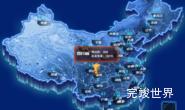
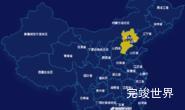
今天整理的是宁夏地图背景图素材

效果演示
组件代码
<template>
  <div class="item1">
    <div class="centerMap" :style="{width:(width)+'px',height:(height)+'px'}" id="centerMap">
    </div>
    <div class="centerMap" style="z-index: 1000;pointer-events: none;"
         :style="{width:(width)+'px',height:(height)+'px'}" id="centerMap2">
      <div class="mapPopWin" style="pointer-events: initial;" v-if="popShow"
           :style="{left:left-110+'px',top:top-130+'px'}">
        <img class="close" @click="popShow=false" src="../assets/close.png" alt="">
        <h3>{{ address }}</h3>
        <div class="info2">
          <p>电站数:368</p>
          <p>总发电量:16516</p>
        </div>
      </div>
    </div>
    <div class="map">
      <img ref="img" src="../assets/ningxiaMap.png" alt="">
    </div>
  </div>
</template>

<script>

import * as echarts from "echarts";
import data from '../assets/data.json'
import mapTag from '../assets/labelImg.png'

export default {
  name: "item1",
  data() {
    return {
      data,
      height: 0,
      width: 0,
      popShow: false,
      left: 0,
      top: 0,
      address: '',
      num: 10,
    }
  },
  components: {
  },
  watch: {},
  mounted() {
    var that = this;
    setTimeout(() => {
      this.getMap()
    }, 500)
  },
  methods: {
    getMap() {
      window.addEventListener('resize', this.getMap)
      this.width = this.$refs.img.offsetWidth
      this.height = this.$refs.img.offsetHeight
      this.$nextTick(() => {
        this.getEcharts()
      })
    },
    getEcharts() {
      var that = this;
      var chartDom = document.getElementById('centerMap');
      var myChart = echarts.init(chartDom);
      myChart.clear()
      myChart.resize()
      var nameMap = '地图数据';
      var geoCoordMap = {};
      var mapData = [];
      var serverdata = []
      // 图标数据
      var iconData = [];
      echarts.registerMap(nameMap, this.data);
      var mapFeatures = echarts.getMap(nameMap).geoJson.features;
      myChart.hideLoading();
      var mapName = ''
      var mapInfo = []
      mapFeatures.forEach(function (v, index) {
        // 地区名称
        mapData.push({
          name: v.properties.name,
          value: Math.random() * 100
        });
        geoCoordMap[v.properties.name] = v.properties.center;
        mapName = mapName + (mapName ? ',' : '') + v.properties.name
        mapInfo.push({
          name: v.properties.name,
          code: v.properties.adcode
        })
        var data = {
          "value": v.properties.center,
          "id": index,
          "name": v.properties.name,
          "num": (Math.random() * 100).toFixed(0)
        }
        iconData.push(data)
      });
      // 生成地图图标
      iconData.forEach((type, index) => {
        var datamap = {
          type: 'scatter',
          tooltip: {
            show: true,
            formatter: function (params) {
              return params.data.name;
            }
          },
          name: type.name,
          coordinateSystem: 'geo',
          symbol: 'image://' + mapTag,
          symbolSize: [68, 28],
          symbolOffset: [-0, -0],
          label: {
            normal: {
              show: true,
              position: 'top',
              offset: [0, 25],
              formatter: function (params) {
                console.log(params)
                var text = `{num|${params.data.num}}\n{name|${params.name}}`
                return text
              },
              color: '#fff',
              rich: {
                name: {
                  padding: [0, 0],
                  color: '#FEFEFE',
                  fontSize: 17,
                  fontWeight: 500,
                  fontFamily: 'YouSheBiaoTiHei'
                },
                num: {
                  padding: [10, 0],
                  color: '#11fffe',
                  fontSize: 20,
                  fontWeight: 500,
                  textAlign: 'center',
                  fontFamily: 'DIN-Bold'
                },
              },
            },
          },
          hoverAnimation: true,
          z: 6,
          data: [type]
        }
        serverdata.push(datamap)
      });
      var optionMap = {
        geo: {
          map: nameMap,
          show: true,
          aspectScale: 0.90,
          layoutCenter: ["49%", "50%"],
          layoutSize: '148%',
          roam: false,
          itemStyle: {
            normal: {
              borderColor: 'rgba(147, 235, 248, 0)',
              borderWidth: 0.5,
              areaColor: 'rgba(147, 235, 248, 1)',
              opacity: 0,
            },
            emphasis: {
              borderColor: 'rgba(147, 235, 248, 0)',
              borderWidth: 0.5,
              areaColor: 'rgba(147, 235, 248, 0)',
              opacity: 0,
            }
          },
          z: 0,
          label: {
            normal: {
              show: false
            },
            emphasis: {
              show: false
            }
          }
        },
        series: [
          // {
          //   type: 'scatter',
          //   tooltip: {
          //     show: true,
          //     formatter: function (params) {
          //       return params.data.name;
          //     }
          //   },
          //   name: '同心县',
          //   zIndex: 10,
          //   coordinateSystem: 'geo',
          //   symbol: 'image://' + activeIcon,
          //   symbolSize: [220, 141],
          //   symbolOffset: [-30, -56],
          //   label: {
          //     normal: {
          //       show: true,
          //       position: 'top',
          //       offset: [10, 55],
          //       formatter: function (params) {
          //         var text = `{title|${params.name}}{num|电站数:368}\n{num2|总发电量:16516}`
          //         return text
          //       },
          //       color: '#fff',
          //       rich: {
          //         title: {
          //           padding: [0, 0, 0, 0],
          //           margin: [0, 0, 0, 0],
          //           color: '#FEFEFE',
          //           fontSize: 20,
          //           width: 60,
          //           fontWeight: 500,
          //           lineHeight: 0,
          //           fontFamily: 'PangMenZhengDao'
          //         },
          //         num: {
          //           padding: [0, 0],
          //           margin: [0, 0],
          //           color: '#FEFEFE',
          //           fontSize: 14,
          //           lineHeight: 25,
          //           fontWeight: 500,
          //           fontFamily: 'PingFang'
          //         },
          //         num2: {
          //           padding: [0, 50, 0, 60],
          //           margin: [0, 0],
          //           color: '#FEFEFE',
          //           fontSize: 14,
          //           fontWeight: 500,
          //           fontFamily: 'PingFang'
          //         },
          //       },
          //     },
          //   },
          //   hoverAnimation: true,
          //   z: 120,
          //   data: [{
          //     "value": [106.274743, 37.036988],
          //     "id": 3,
          //     "name": '同心县',
          //   }]
          // },
          // ...serverdata,
        ]
      };
      myChart.clear()
      myChart.resize()
      myChart.setOption(optionMap);
      myChart.off('click')
      myChart.on('click', function (params) {
        console.log(params)
        that.left = params.event.event.offsetX;
        that.top = params.event.event.offsetY;
        that.popShow = false
        that.$nextTick(() => {
          that.popShow = true
        })
        that.address = params.name
        let data = myChart.convertFromPixel('geo', [that.left, that.top])
        console.log(data)
        // that.getPositionByLonLats(data[0], data[1])
        // myChart.off('click')
        // myChart.setOption(optionMap, false)
        // myChart.off('click')
      })
      that.address = '吴忠市'
      let datas = myChart.convertToPixel('geo', [105.91539006101597, 36.941582538367875]);
      that.left = datas[0];
      that.top = datas[1];
      that.popShow = false
      that.$nextTick(() => {
        that.popShow = true
      })
    }
  },
}
</script>

<style lang="scss" scoped>
.item1 {
  position: relative;
  width: 100%;
  height: 100%;
  display: flex;
  justify-content: center;
  align-items: center;
  flex-wrap: nowrap;
  flex-direction: row;
  align-content: flex-start;
}

.map {
  //background: url("../assets/centerMap.png") center center no-repeat;
  //background-size: 1024px 783px;
  width: 100%;
  height: 100%;
  display: flex;
  justify-content: center;
  align-items: center;
  flex-wrap: nowrap;
  flex-direction: row;
  align-content: flex-start;
  margin: 0 auto;
  position: absolute;
  transform: rotate(-3deg);
  -ms-transform: rotate(-3deg);
  /* Internet Explorer 9*/
  -moz-transform: rotate(-3deg);
  /* Firefox */
  -webkit-transform: rotate(-3deg);
  /* Safari 和 Chrome */
  -o-transform: rotate(-3deg);
  z-index: 0;

  img {
    height: 100%;
    max-width: 100%;
    max-height: 100%;
  }
}

.centerMap {
  width: 100%;
  height: 100%;
  position: absolute;
  z-index: 1;
  //top: -100px;
}

.titleTop {
  position: absolute;
  top: 0;
  width: 100%;
  left: 0;
  z-index: 100;
  display: flex;
  justify-content: center;
  align-items: center;
  flex-wrap: nowrap;
  flex-direction: column;
  align-content: flex-start;

  :deep(.titleTopDesc) {
    display: flex;
    justify-content: center;
    align-items: center;
    flex-wrap: nowrap;
    flex-direction: row;
    align-content: flex-start;

    .real-time-num {
      font-size: 22px;
      font-family: DIN;
      font-weight: 500;
      width: auto;
      margin: 0;
      color: #1AFFFF;
    }

  }

  .unit {
    display: flex;
    justify-content: center;
    align-items: center;
    flex-wrap: nowrap;
    flex-direction: row;
    align-content: flex-start;
    margin-top: -3px;
    margin-left: 3px;
  }

  .titleTopDesc {
    display: flex;
    justify-content: center;
    align-items: center;
    flex-wrap: nowrap;
    flex-direction: row;
    align-content: flex-start;
  }
}

.infoWin {
  background: red;
  width: 100px;
  height: 100px;
}

.mapPopWin {
  position: absolute;
  left: 0;
  top: 0;
  background: url("../assets/activeIcon.png") no-repeat;
  background-size: 100% 100%;
  width: 220PX;
  height: 141PX;
  display: flex;
  justify-content: flex-start;
  align-items: flex-start;
  flex-wrap: nowrap;
  flex-direction: row;
  align-content: flex-start;
  z-index: 10000;

  .close {
    position: absolute;
    right: 0;
    top: 0;
    cursor: pointer;
    width: 20px;
    height: 20px;
  }

  h3 {
    margin-left: 15px;
    font-size: 22px;
    font-family: PangMenZhengDao;
    font-weight: 400;
    color: #FEFEFE;
  }

  .info2 {
    font-size: 14px;
    font-family: PingFang;
    font-weight: 500;
    color: #FFFFFF;
    display: flex;
    justify-content: flex-start;
    align-items: flex-start;
    flex-wrap: nowrap;
    flex-direction: column;
    margin-top: 17px;
    margin-left: 10px;
    align-content: flex-start;

    p {
      margin: 0px;
    }
  }
}
</style>