项目实例
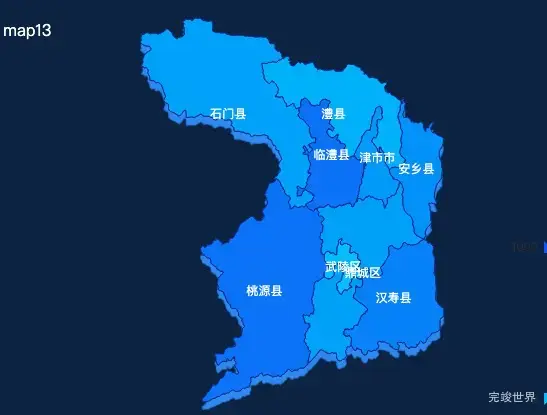
vue 数据大屏案例 安全预警系统
实例代码
<template>
  <div class="echarts1" ref="echarts">

  </div>
</template>

<script>
import map from './map.json'
import {FontChart} from "@/utils/utils";

export default {
  name: 'echarts1',
  components: {},
  props: {
    id: {
      type: String,
      default() {
        return ''
      }
    }
  },
  data() {
    return {
      status: '',
      datas: [],
      active: 0,
      time: null
    }
  },
  watch: {},
  mounted() {
    this.drawechartmap()
  },
  methods: {
    drawechartmap() {
      var that = this
      window.addEventListener('resize', this.drawechartmap)
      var myChart = this.$echarts.init(this.$refs.echarts)
      var geoCoordMap = {};
      myChart.off('click')
      var nameMap = '常德市';
      this.$echarts.registerMap(nameMap, map)
      window.dataList = [
        {
          name: '武陵区',
          value: 39,
        }, {
          name: '澧县',
          value: 106,
        }, {
          name: '鼎城区',
          value: 206,
        }, {
          name: '安乡县',
          value: 396,
        }, {
          name: '汉寿县',
          value: 496,
        }, {
          name: '桃源县',
          value: 596,
        }, {
          name: '临澧县',
          value: 606,
        }, {
          name: '石门县',
          value: 196,
        }, {
          name: '津市市',
          value: 296,
        },
      ];
      /*获取地图数据*/
      myChart.showLoading();
      var mapFeatures = this.$echarts.getMap(nameMap).geoJson.features;
      myChart.hideLoading();
      mapFeatures.forEach(function (v) {
        // 地区名称
        var name = v.properties.name;
        // 地区经纬度
        geoCoordMap[name] = v.properties.center;
      });
      var serverdata = [
        { // 地图块的相关信息
          type: 'map',
          name: '全区工程数量分布',
          map: nameMap,
          zoom: 1.2,
          itemStyle: {
            normal: {
              borderColor: 'rgba(14, 34, 150, 1.00)',
              borderWidth: 1,
              areaColor: '#416ef8'
            },
            emphasis: {
              areaColor: '#416ef8',
              borderWidth: 0,
              label: {
                show: true,
                color: '#fff'
              },
            }
          },
          select: {
            label: {
              show: true,
              color: '#fff',
              normal: {
                show: true,
                textStyle: {
                  fontSize: FontChart(14),
                  fontWeight: 400,
                  color: '#fff'
                }
              },
              emphasis: {
                textStyle: {
                  fontSize: FontChart(14),
                  fontWeight: 400,
                  color: '#fff'
                }
              }
            },
            itemStyle: {
              areaColor: '#416ef8',
              borderWidth: 0,
            }
          },
          label: {
            show: true,
            normal: {
              show: true,
              textStyle: {
                fontSize: FontChart(14),
                fontWeight: 400,
                color: '#fff'
              }
            },
            emphasis: {
              textStyle: {
                fontSize: FontChart(14),
                fontWeight: 400,
                color: '#fff'
              }
            }
          },
          data: window.dataList
        },
        {
          type: 'effectScatter',
          coordinateSystem: 'geo',
          z: 5,
          data: [],
          symbolSize: 14,
          itemStyle: {
            normal: {
              borderColor: 'rgba(14, 34, 150, 1.00)',
              borderWidth: 1,
              areaColor: '#416ef8'
            },
            emphasis: {
              areaColor: '#416ef8',
              borderWidth: 0,
              label: {
                show: true,
                color: '#fff',
                normal: {
                  show: true,
                  textStyle: {
                    fontSize: FontChart(14),
                    fontWeight: 400,
                    color: '#fff'
                  }
                },
                emphasis: {
                  show: true,
                  textStyle: {
                    fontSize: FontChart(14),
                    fontWeight: 400,
                    color: '#fff'
                  }
                }
              },
            }
          }
        },
      ]
      var optionMap = {
        tooltip: {
          trigger: 'item',
          show: true,
        },
        visualMap: [{
          min: 0,
          max: 1000,
          show: true,
          right: 20,
          bottom: 0,
          realtime: true,
          calculable: true,
          seriesIndex: [0],
          inRange: {
            color: ['#015afe', '#0160ff', '#0079ff', '#0b97ff', '#14a9ff', '#21c8ff'].reverse()
          }
        }],
        geo: {
          map: nameMap,
          show: true,
          roam: false, //是否允许缩放
          zoom: 1.2, //默认显示级别
          itemStyle: {
            normal: {
              areaColor: '#3391f8',
              shadowColor: '#3391f8',
              shadowBlur: 1,
              shadowOffsetX: 0,
              shadowOffsetY: 8,
            }
          },
          label: {
            normal: {
              show: false
            },
            emphasis: {
              show: false
            }
          }
        },
        series: serverdata
      };
      myChart.clear()
      myChart.resize()
      myChart.setOption(optionMap, true);
    }
  }
}
</script>

<style lang="scss" scoped>
.echarts1 {
  position: relative;
  width: 100%;
  height: calc(100% - 0px);
}
</style>
github
Echarts 常德市地图实例效果