实例代码
<template>
<div class="echarts1">
<div class="echarts1" ref="echarts">
</div>
</div>
</template>
<script>
import jiaxing from './map.json'
import caiyaoimg from './assets/mapicon.png'
import {FontChart} from "@/utils/utils";
export default {
name: 'echarts1',
props: {
id: {
type: String,
default() {
return ''
}
}
},
data() {
return {
status: '',
xdata: [],
ydata: [],
list: jiayao,
vlist: []
}
},
watch: {},
mounted() {
this.drawLine()
},
methods: {
getpop(item) {
var that = this
that.vlist = []
var data = []
that.list.forEach((type) => {
if (type.name == item) {
data = type.vlist
}
})
that.$nextTick(() => {
that.vlist = data
that.$nextTick(() => {
that.$refs.popvideo.getshow()
})
})
},
drawLine() {
var that = this
window.addEventListener('resize', this.drawLine)
var myChart = this.$echarts.init(this.$refs.echarts)
this.$echarts.registerMap('js', jiaxing)
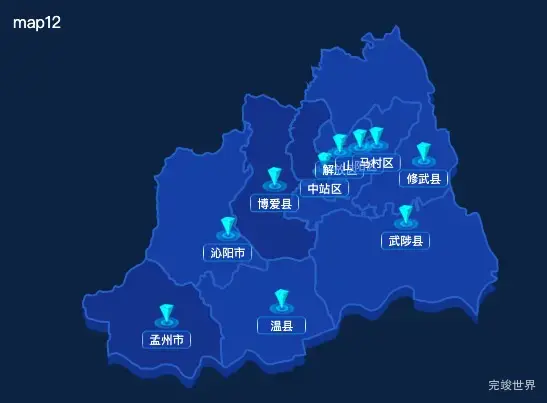
var mapdata = [
{
name: '孟州市',
value: 100,
values: [112.788482,34.910993],
img: caiyaoimg
}, {
name: '温县',
value: 10,
values: [113.086854,34.938797],
img: caiyaoimg
}, {
name: '沁阳市',
value: 20,
values: [112.947455,35.080317],
img: caiyaoimg
}, {
name: '博爱县',
value: 100,
values: [113.068466,35.1766],
img: caiyaoimg
}, {
name: '中站区',
value: 100,
values: [113.197786,35.205583],
img: caiyaoimg
}, {
name: '解放区',
value: 20,
values: [113.237285,35.241357],
img: caiyaoimg
}, {
name: '山阳区',
value: 61,
values: [113.289521,35.250699],
img: caiyaoimg
}, {
name: '修武县',
value: 61,
values: [113.454872,35.224369],
img: caiyaoimg
}, {
name: '马村区',
value: 61,
values: [113.33228,35.255057],
img: caiyaoimg
}, {
name: '武陟县',
value: 61,
values: [113.408681,35.10324],
img: caiyaoimg
}
]
var data2 = []
mapdata.forEach((type) => {
var datas = {
type: 'scatter',
coordinateSystem: 'geo',
label: {
normal: {
show: true,
position: 'top',
offset: [0, FontChart(57)],
formatter: function (params) {
var text = `{fline|${params.name}}`
return text
},
color: '#fff',
rich: {
fline: {
padding: [0, 0],
color: '#fff',
fontSize: FontChart(14),
fontWeight: 400,
},
},
},
emphasis: {
show: true,
position: 'top',
offset: [0, FontChart(62)],
formatter: function (params) {
var text = `{fline|${params.name}}`
return text
},
color: '#fff',
rich: {
fline: {
padding: [0, 0],
color: '#fff',
fontSize: FontChart(14),
fontWeight: 400,
},
},
},
},
itemStyle: {
color: '#0e349a',
opacity: 1,
},
symbol: function (value, params) {
return 'image://' + type.img
},
symbolSize: [FontChart(60), FontChart(55)],
symbolOffset: [-0, -0],
z: 999,
data: [{
name: type.name,
value: type.values,
number: 1354,
}],
}
data2.push(datas)
})
var option = {
visualMap: {
show: false,
max: 100,
pieces: [
{
max: 15,
min: 0,
label: '安全',
color: {
type: 'radial',
x: 0.5,
y: 0.5,
r: 1,
colorStops: [{
offset: 0,
color: '#0f44b3' // 0% 处的颜色
}, {
offset: 1,
color: '#0f44b3' // 100% 处的颜色
}],
globalCoord: false // 缺省为 false
}
},
{
max: 90,
min: 20,
label: '安全',
color: {
type: 'radial',
x: 0.5,
y: 0.5,
r: 1,
colorStops: [{
offset: 0,
color: '#0f44b3' // 0% 处的颜色
}, {
offset: 1,
color: '#0f44b3' // 100% 处的颜色
}],
globalCoord: false // 缺省为 false
}
},
{
min: 100,
label: '危险',
color: {
type: 'radial',
x: 0.5,
y: 0.5,
r: 1,
colorStops: [{
offset: 0,
color: '#0f44b3' // 0% 处的颜色
}, {
offset: 1,
color: '#0f44b3' // 100% 处的颜色
}],
globalCoord: false // 缺省为 false
}
},
]
},
tooltip: {
trigger: 'item',
showDelay: 0,
transitionDuration: 0.2,
borderWidth: 0,
padding: [5, 10, 5, 10],
show: true,
formatter: function (params) {
return params.name
}
},
geo: [
{
map: 'js',
roam: false, //是否允许缩放
zoom: 1.1, //默认显示级别
scaleLimit: {
min: 0,
max: 3
}, //缩放级别
itemStyle: {
normal: {
areaColor: '#0e349a',
shadowColor: '#0a399b',
shadowBlur: 1,
shadowOffsetX: 0,
shadowOffsetY: 10,
}
},
}],
series: [
{
type: 'effectScatter',
coordinateSystem: 'geo',
z: 5,
data: [],
symbolSize: 14,
label: {
normal: {
show: false,
formatter: function (params) {
return '{fline|地点:' + params.data.city + '}\n{tline|' + (params.data.info || '发生xx集件') + '}'
},
position: 'top',
backgroundColor: '#00BCFF',
padding: [0, 0],
borderRadius: 3,
lineHeight: 32,
color: '#00BCFF',
rich: {
fline: {
padding: [0, 10, 10, 10],
color: '#ffffff'
},
tline: {
padding: [10, 10, 0, 10],
color: '#ffffff'
}
}
},
emphasis: {
show: true
}
},
itemStyle: {
color: 'rgba(13, 38, 77, 1)',
}
},
{
type: 'map',
mapType: 'js',
geoIndex: -1,
zoom: 1.1, //默认显示级别
label: {
show: false,
color: 'rgba(13, 38, 77, 1)',
emphasis: {
color: 'white',
show: false
}
},
itemStyle: {
normal: {
borderColor: '#2768d3',
borderWidth: 2
},
emphasis: {
areaColor: {
type: 'radial',
x: 0.5,
y: 0.5,
r: 1,
colorStops: [{
offset: 0,
color: '#00BCFF' // 0% 处的颜色
}, {
offset: 1,
color: '#00BCFF' // 100% 处的颜色
}],
globalCoord: false // 缺省为 false
},
borderWidth: 0,
color: 'green'
}
},
data: mapdata
},
...data2
]
}
myChart.resize()
myChart.on('click', function (params) {
that.getpop(params.name)
})
myChart.setOption(option)
}
}
}
</script>
<style lang="scss" scoped>
.echarts1 {
position: relative;
width: 100%;
height: calc(100% - 0px);
z-index: 1;
}
</style>
github
github