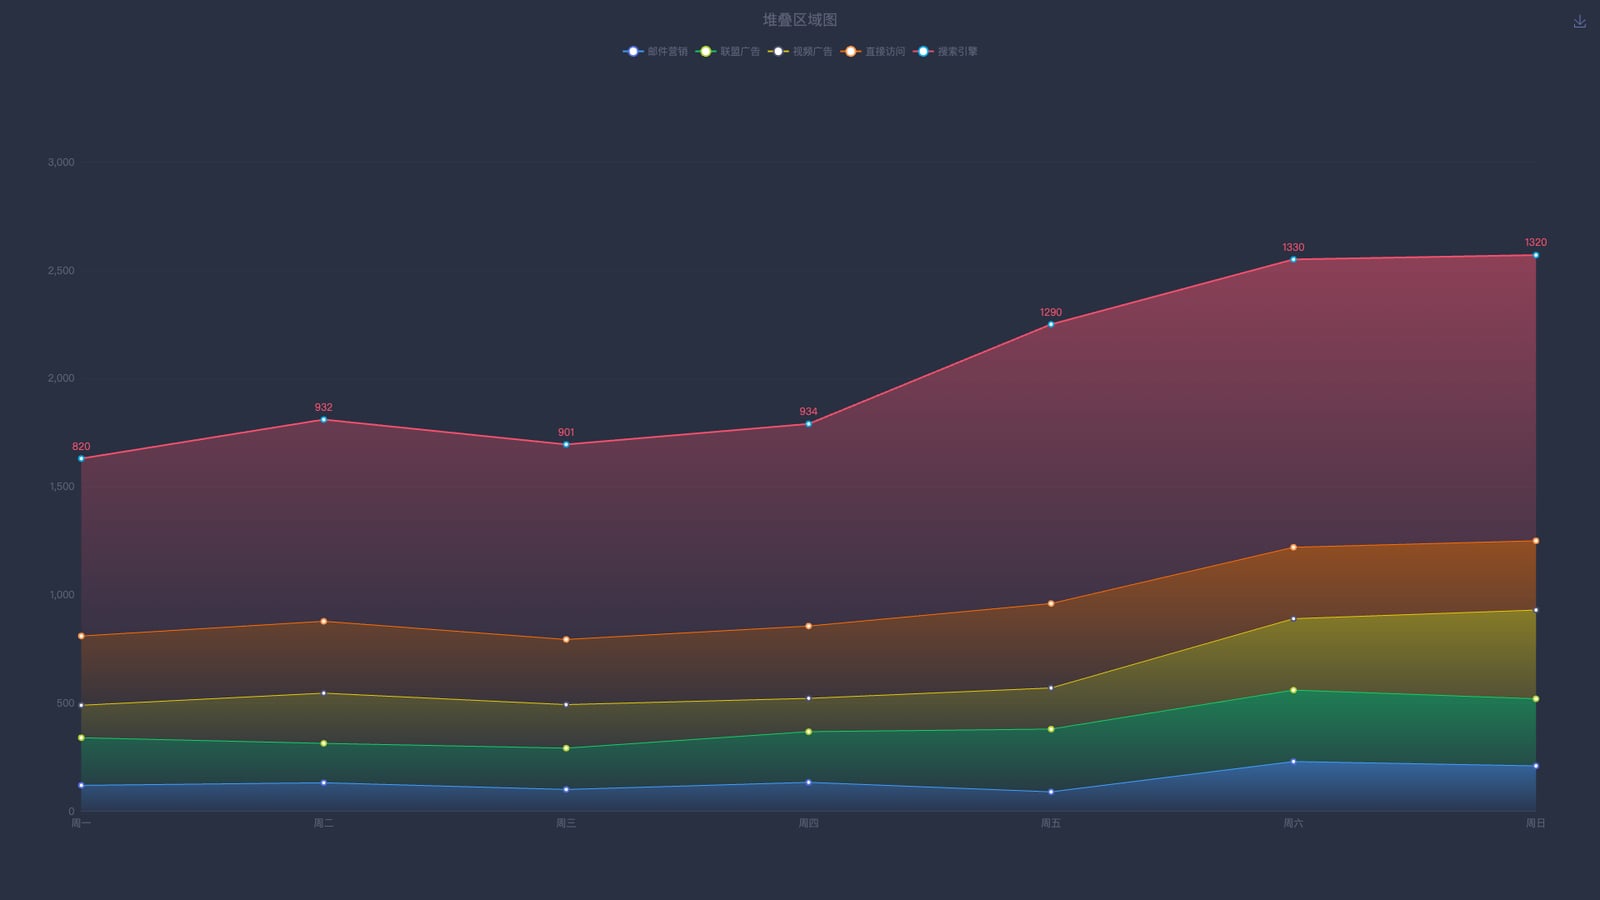
echarts折线图实现堆叠效果图

js

echarts折线图实现堆叠效果图

ID

11

配置代码

const option = {
        backgroundColor: '#293042',
        title: {
            text: '堆叠区域图',
            left: 'center',
            top: 10,
            textStyle: {
                color: '#5c6076',
                fontSize: 18,
                fontWeight: 400
            }
        },
        tooltip: {
            trigger: 'axis',
            backgroundColor: '#384157',
            borderColor: '#384157',
            borderWidth: 1,
            extraCssText: 'box-shadow: 0 0 5px rgba(0, 0, 0, 1)'
        },
        legend: {
            top: 50,
            data: ['邮件营销', '联盟广告', '视频广告', '直接访问', '搜索引擎'],
            textStyle: {
                color: '#5c6076'
            }
        },
        toolbox: {
            feature: {
                saveAsImage: {}
            }
        },
        grid: {
            left: '3%',
            right: '4%',
            bottom: '8%',
            top: '18%',
            containLabel: true
        },
        xAxis: [{
            type: 'category',
            boundaryGap: false,
            data: ['周一', '周二', '周三', '周四', '周五', '周六', '周日'],
            axisLine: {
                lineStyle: {
                    color: '#384157'
                }
            },
            axisLabel: {
                textStyle: {
                    color: '#5c6076'
                }
            },
            axisTick: {
                show: false
            }
        }],
        yAxis: [{
            type: 'value',
            axisLine: {
                show: false
            },
            axisLabel: {
                textStyle: {
                    color: '#5c6076'
                }
            },
            splitLine: {
                show: true,
                lineStyle: {
                    color: '#2e3547'
                }
            }
        }],
        series: [
            {
                name: '邮件营销',
                type: 'line',
                stack: '总量', // 堆叠关键:相同 stack 值会堆叠
                areaStyle: {
                    normal: {
                        color: new echarts.graphic.LinearGradient(0, 0, 0, 1, [
                            { offset: 0, color: 'rgba(64, 158, 255, 0.7)' },
                            { offset: 1, color: 'rgba(64, 158, 255, 0.1)' }
                        ])
                    }
                },
                lineStyle: {
                    color: '#409eff',
                    width: 1
                },
                data: [120, 132, 101, 134, 90, 230, 210]
            },
            {
                name: '联盟广告',
                type: 'line',
                stack: '总量',
                areaStyle: {
                    normal: {
                        color: new echarts.graphic.LinearGradient(0, 0, 0, 1, [
                            { offset: 0, color: 'rgba(19, 206, 102, 0.7)' },
                            { offset: 1, color: 'rgba(19, 206, 102, 0.1)' }
                        ])
                    }
                },
                lineStyle: {
                    color: '#13ce66',
                    width: 1
                },
                data: [220, 182, 191, 234, 290, 330, 310]
            },
            {
                name: '视频广告',
                type: 'line',
                stack: '总量',
                areaStyle: {
                    normal: {
                        color: new echarts.graphic.LinearGradient(0, 0, 0, 1, [
                            { offset: 0, color: 'rgba(230, 200, 11, 0.7)' },
                            { offset: 1, color: 'rgba(230, 200, 11, 0.1)' }
                        ])
                    }
                },
                lineStyle: {
                    color: '#e6c80b',
                    width: 1
                },
                data: [150, 232, 201, 154, 190, 330, 410]
            },
            {
                name: '直接访问',
                type: 'line',
                stack: '总量',
                areaStyle: {
                    normal: {
                        color: new echarts.graphic.LinearGradient(0, 0, 0, 1, [
                            { offset: 0, color: 'rgba(255, 109, 0, 0.7)' },
                            { offset: 1, color: 'rgba(255, 109, 0, 0.1)' }
                        ])
                    }
                },
                lineStyle: {
                    color: '#ff6d00',
                    width: 1
                },
                data: [320, 332, 301, 334, 390, 330, 320]
            },
            {
                name: '搜索引擎',
                type: 'line',
                stack: '总量',
                label: {
                    normal: {
                        show: true,
                        position: 'top',
                        textStyle: {
                            color: '#f4516c'
                        }
                    }
                },
                areaStyle: {
                    normal: {
                        color: new echarts.graphic.LinearGradient(0, 0, 0, 1, [
                            { offset: 0, color: 'rgba(244, 81, 108, 0.7)' },
                            { offset: 1, color: 'rgba(244, 81, 108, 0.1)' }
                        ])
                    }
                },
                lineStyle: {
                    color: '#f4516c',
                    width: 2
                },
                data: [820, 932, 901, 934, 1290, 1330, 1320]
            }
        ]
    };

完整示例代码

喜欢