vue3 数据可视化大屏 衡水市人口数据监控平台
id
308
运行环境
nodejs 23
开发框架
vue3 vite js
分辨率
1920*1080
演示地址
vue3 数据可视化大屏 衡水市人口数据监控平台
演示demo:vue3 数据可视化大屏 衡水市人口数据监控平台
效果截图

视频演示
数据总览
数字卡片展示
人口总数
常住人口
流动人口

性别分布
饼状图展示性别分布

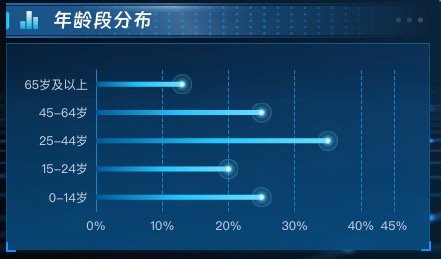
年龄段分布
横向柱状图展示年龄段分布
65岁及以上
45—64岁
25-44岁
15-24岁
0-14岁
学历分布
饼状图展示学历分布
高中及以下
大专
本科
硕士及以上

户口性质
水球图展示户口性质

婚姻状况
饼状图展示婚姻状况
未婚
已婚
离异
丧偶

3d地图
3d地图,自动轮播切换地区,其他模块监测切换刷新数据

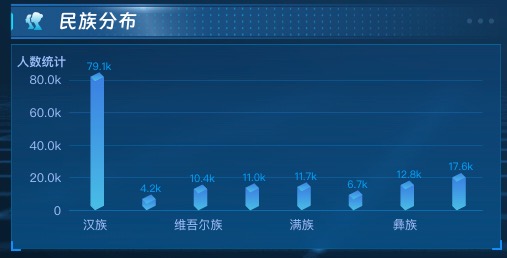
民族分布
柱状图展示民族分布
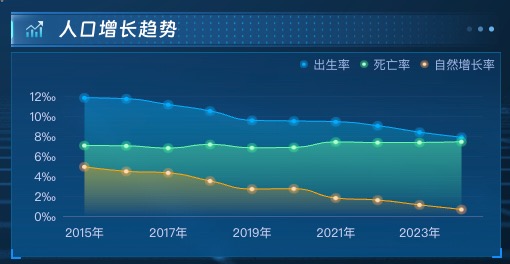
人口增长趋势
折线图展示人口增长趋势
项目依赖
{
  "name": "308_renkoushuju_vue3",
  "private": true,
  "version": "1.0.0",
  "type": "module",
  "scripts": {
    "dev": "vite",
    "build": "vite build",
    "build-qiniu": "vite build && node ./qiniu.js",
    "preview": "vite preview"
  },
  "dependencies": {
    "@meruem117/vue-seamless-scroll": "^0.1.8",
    "autoprefixer": "^10.4.13",
    "axios": "^1.5.1",
    "dayjs": "^1.11.7",
    "disable-devtool": "^0.3.7",
    "echarts": "^5.4.3",
    "echarts-gl": "^2.0.9",
    "echarts-liquidfill": "^3.1.0",
    "fs": "0.0.1-security",
    "gsap": "^3.11.4",
    "pinia": "^3.0.3",
    "postcss": "^8.4.21",
    "postcss-loader": "^7.0.2",
    "postcss-pxtorem": "^6.0.0",
    "qiniu": "^7.8.0",
    "sass": "^1.57.1",
    "sass-loader": "^13.2.0",
    "style-loader": "^3.3.1",
    "vue": "^3.2.45",
    "vue-router": "^4.1.6",
    "wow.js": "^1.2.2"
  },
  "devDependencies": {
    "@vitejs/plugin-vue": "^4.0.0",
    "vite": "^4.0.0"
  }
}
部分代码
<template>
  <div class="echarts1" ref="echarts"></div>
</template>

<script>
import * as echarts from "echarts"
import dot1 from './assets/icon_dot1.png'
import dot2 from './assets/icon_dot2.png'
import dot3 from './assets/icon_dot3.png'
import { FontChart, generateRandomSeriesByRegion, debounce } from "@/utils/utils.js";
import { useMapStore } from "@/store/index.js";
import { storeToRefs } from "pinia";

export default {
  name: 'echarts1',
  components: {},
  data() {
    return {
      list: [
        {name: '2015年', value: 12.07, value2: 7.11, value3: 4.96},
        {name: '2016年', value: 12.95, value2: 7.09, value3: 5.86},
        {name: '2017年', value: 12.43, value2: 7.11, value3: 5.32},
        {name: '2018年', value: 10.94, value2: 7.13, value3: 3.81},
        {name: '2019年', value: 10.48, value2: 7.14, value3: 3.34},
        {name: '2020年', value: 8.52, value2: 7.07, value3: 1.45},
        {name: '2021年', value: 7.52, value2: 7.18, value3: 0.34},
        {name: '2022年', value: 6.77, value2: 7.37, value3: -0.60},
        {name: '2023年', value: 6.39, value2: 7.87, value3: -1.48},
        {name: '2024年', value: 6.35, value2: 7.87, value3: -1.52}
      ],
      chart: null,
      unwatchFns: []
    }
  },
  mounted() {
    this.init()
  },
  beforeUnmount() {
    // 解绑监听
    this.unwatchFns.forEach(fn => typeof fn === 'function' && fn())
    this.unwatchFns = []
    // 销毁图表
    if (this.chart) {
      this.chart.dispose()
      this.chart = null
    }
    // 移除 resize 监听
    window.removeEventListener('resize', this._onResize, false)
  },
  methods: {
    init() {
      // 初始化图表
      this.chart = echarts.init(this.$refs.echarts)

      // 首次渲染
      this.drawEcharts()

      // 监听窗口变化(防抖)
      this._onResize = debounce(() => {
        if (this.chart) this.chart.resize()
      }, 150)
      window.addEventListener('resize', this._onResize, false)

      // 监听 store 变化
      const mapStore = useMapStore()
      const { getCurrentAdcode, getMapData } = storeToRefs(mapStore)

      const stop1 = this.$watch(
          () => getCurrentAdcode.value,
          (newAdcode, oldAdcode) => {
            this.refreshDataByStore(getMapData.value)
          }
      )
      const stop2 = this.$watch(
          () => getMapData.value,
          (newVal, oldVal) => {
            // 根据 mapData 的变化(regionName/adcode/timestamp)刷新
            this.refreshDataByStore(newVal)
          },
          { deep: true }
      )

      this.unwatchFns.push(stop1, stop2)
    },

    refreshDataByStore(mapData) {
      // 根据 store 中的 regionName/adcode 生成稳定随机数据
      const seed = `${mapData?.regionName || ''}-${mapData?.adcode || ''}-${mapData?.timestamp || ''}`
      const randomList = generateRandomSeriesByRegion({ startYear: 2015, endYear: 2024, seed })
      this.setChartData(randomList)
    },

    setChartData(list) {
      // 更新数据并重绘
      this.list = Array.isArray(list) && list.length ? list : this.list
      this.drawEcharts()
    },

    drawEcharts() {
      if (!this.chart) return
      const option = {
        grid: {
          top: FontChart(50),
          bottom: FontChart(20),
          left: FontChart(20),
          right: FontChart(20),
          containLabel: true
        },
        tooltip: {
          trigger: 'axis',
          axisPointer: {
            type: 'shadow',
            shadowStyle: {
              color: new echarts.graphic.LinearGradient(0, 0, 0, 1, [{
                offset: 0,
                color: 'rgba(255, 255, 255, 0.1)'
              }, {
                offset: 1,
                color: 'rgba(255, 255, 255, 0.5)'
              }], false),
            }
          },
          formatter: (params) => {
            let result = params[0].name + '<br/>'
            params.forEach(function(item) {
              result += item.marker + item.seriesName + ': ' + item.value + '‰<br/>'
            })
            return result
          }
        },
        legend: {
          top: 0,
          right: 0,
          itemWidth: FontChart(10),
          itemHeight: FontChart(10),
          textStyle: {
            color: 'rgba(157, 185, 233, 1)',
            fontSize: FontChart(14)
          },
          data: [
            {name: '出生率', icon: 'image://' + dot1},
            {name: '死亡率', icon: 'image://' + dot2},
            {name: '自然增长率', icon: 'image://' + dot3},
          ],
        },
        xAxis: [
          {
            data: this.list.map(obj => obj.name),
            axisLabel: {
              margin: 10,
              color: 'rgba(202, 215, 245, 1)',
              textStyle: {
                fontSize: FontChart(14)
              },
            },
            axisLine: {
              lineStyle: {
                color: 'rgba(134, 146, 185, 0.36)',
                width: 1
              }
            },
            splitLine: {
              show: false,
              lineStyle: {
                color: 'rgba(39, 76, 129, 0.26)',
                width: 1,
              }
            },
            axisTick: {
              show: false
            },
          }],
        yAxis: [
          {
            axisLabel: {
              color: 'rgba(202, 215, 245, 1)',
              textStyle: {
                fontSize: FontChart(14)
              },
              formatter: '{value}‰'
            },
            axisLine: {
              lineStyle: {
                color: 'rgba(134, 146, 185, 1)',
              }
            },
            axisTick: {
              show: false
            },
            splitLine: {
              show: true,
              lineStyle: {
                color: 'rgba(39, 76, 129, 0.26)',
                width: 1,
              }
            }
          }],
        series: [
          {
            name: '出生率',
            type: 'line',
            data: this.list.map(obj => obj.value),
            smooth: true,
            symbol: 'image://' + dot1,
            symbolSize: 11,
            itemStyle: {
              normal: {
                color: 'rgba(0, 174, 255, 1)',
                lineStyle: {
                  color: 'rgba(0, 174, 255, 1)',
                  width: 1,
                },
              },
            },
            areaStyle: {
              normal: {
                color: new echarts.graphic.LinearGradient(0, 0, 0, 1, [{
                  offset: 0,
                  color: 'rgba(0, 174, 255, 0.5)'
                },
                  {
                    offset: 1,
                    color: 'rgba(0, 240, 203, 0)'
                  }], false),
              }
            },
          },
          {
            name: '死亡率',
            type: 'line',
            data: this.list.map(obj => obj.value2),
            smooth: true,
            symbol: 'image://' + dot2,
            symbolSize: 11,
            itemStyle: {
              normal: {
                color: 'rgba(102, 255, 166, 1)',
                lineStyle: {
                  color: 'rgba(102, 255, 166, 1)',
                  width: 1,
                },
              },
            },
            areaStyle: {
              normal: {
                color: new echarts.graphic.LinearGradient(0, 0, 0, 1, [{
                  offset: 0,
                  color: 'rgba(102, 255, 166, 0.5)'
                },
                  {
                    offset: 1,
                    color: 'rgba(102, 255, 166,0)'
                  }], false),
              }
            },
          },
          {
            name: '自然增长率',
            type: 'line',
            data: this.list.map(obj => obj.value3),
            smooth: true,
            symbol: 'image://' + dot3,
            symbolSize: 11,
            itemStyle: {
              normal: {
                color: 'rgba(255, 166, 0, 1)',
                lineStyle: {
                  color: 'rgba(255, 166, 0, 1)',
                  width: 1,
                },
              },
            },
            areaStyle: {
              normal: {
                color: new echarts.graphic.LinearGradient(0, 0, 0, 1, [{
                  offset: 0,
                  color: 'rgba(255, 166, 0, 0.5)'
                },
                  {
                    offset: 1,
                    color: 'rgba(255, 166, 0, 0)'
                  }], false),
              }
            },
          },
        ]
      }
      this.chart.clear()
      this.chart.setOption(option, true)
    },
  }
}
</script>

<style lang="scss" scoped>
.echarts1 {
  position: relative;
  width: 100%;
  height: 100%;
}
</style>
大屏数据可视化模板
更多背景图资源
项目文件目录

源码下载
项目基于vue3+vite+js开发 nodejs 23
获取代码前请确保具备相关开发基础
本项目为纯前端大屏,无后端支持
默认数据为模拟数据,实际使用时需接入真实数据源
请在确认需求后再获取相关代码
如需vue2版本请访问:衡水市人口数据监控平台 - 数据可视化大屏 vue2


