ID
16
配置代码
const option = {
backgroundColor: 'transparent',
title: {
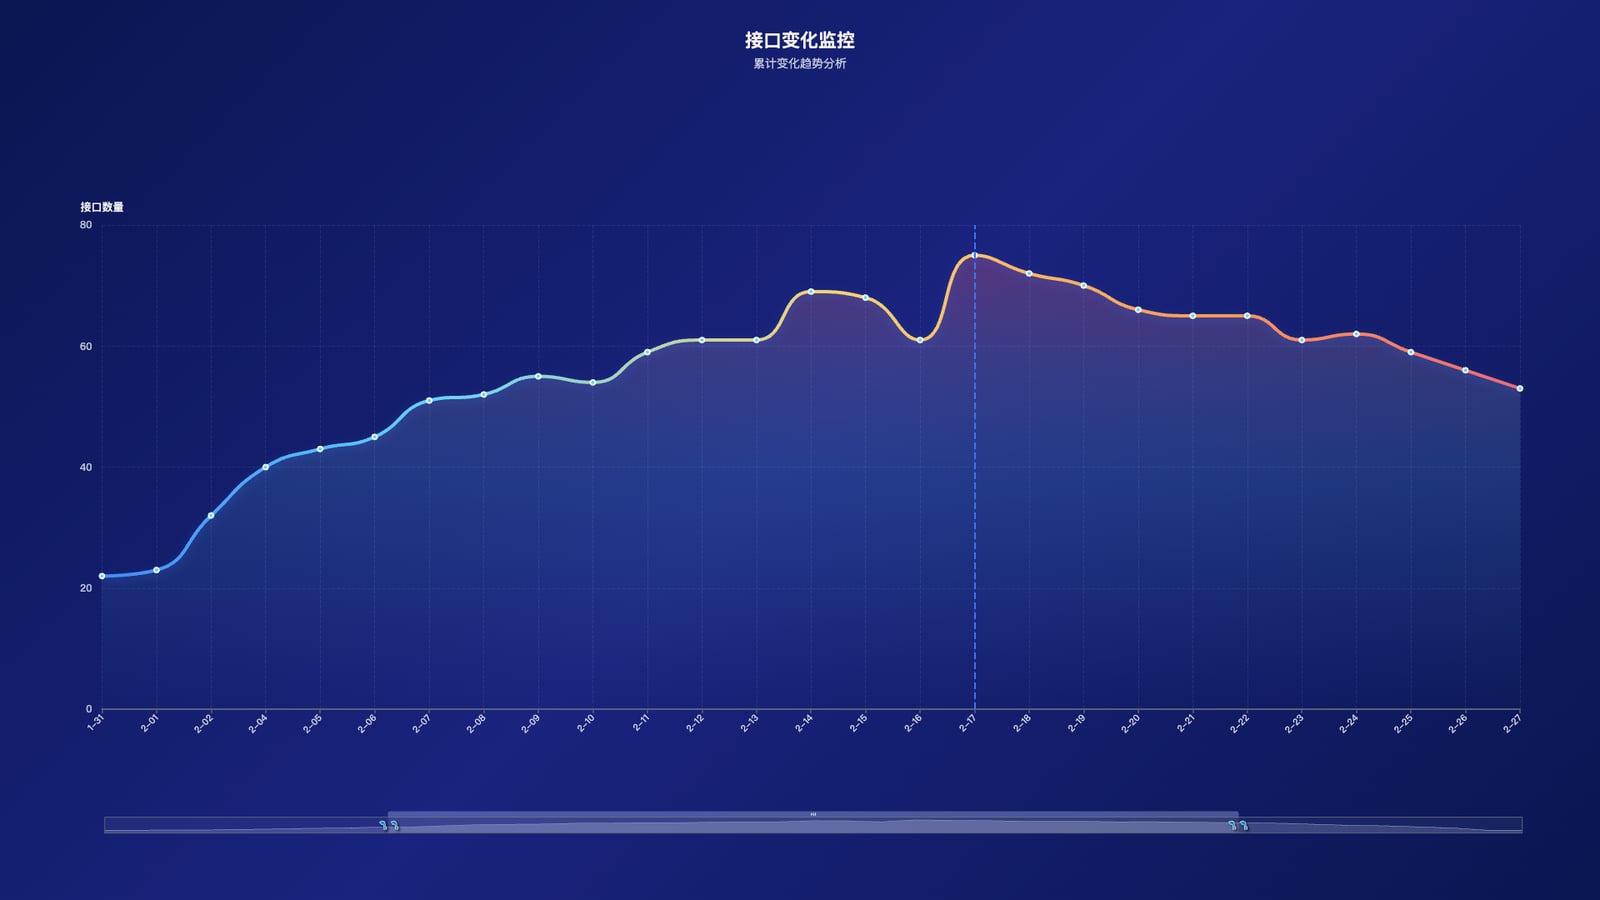
text: '接口变化监控',
subtext: '累计变化趋势分析',
left: 'center',
top: '3%',
textStyle: {
fontSize: 22,
fontWeight: 'bold',
color: '#F1F1F3'
},
subtextStyle: {
fontSize: 14,
color: 'rgba(241,241,243,0.8)'
}
},
tooltip: {
trigger: 'axis',
axisPointer: {
type: 'cross',
lineStyle: {
color: '#00a1ea',
width: 1,
type: 'dashed'
}
},
backgroundColor: 'rgba(10,22,81,0.95)',
borderColor: '#00a1ea',
borderWidth: 1,
textStyle: {
fontSize: 13,
color: '#F1F1F3'
},
extraCssText: 'box-shadow: 0 6px 20px rgba(0,0,0,0.4); border-radius: 10px;',
formatter: (params) => {
return `
<div style="padding: 8px;">
<div style="font-size: 14px; margin-bottom: 4px;">日期:${params[0].axisValue}</div>
<div style="font-size: 13px;">接口数量:${params[0].value}</div>
</div>
`;
}
},
dataZoom: [{
type: 'slider',
show: true,
xAxisIndex: [0],
start: 20,
end: 80,
realtime: true,
height: 20,
bottom: '8%',
handleIcon: 'M10.7,11.9v-1.3H9.3v1.3c0,0.8-0.4,1.6-1,1.6c-0.2,0-0.4-0.1-0.5-0.2l-1,1.3c0.4,0.4,1,0.7,1.6,0.7c0.9,0,1.6-0.7,1.6-1.6V11.9z M17.3,11.9v-1.3H15.9v1.3c0,0.8-0.4,1.6-1,1.6c-0.2,0-0.4-0.1-0.5-0.2l-1,1.3c0.4,0.4,1,0.7,1.6,0.7c0.9,0,1.6-0.7,1.6-1.6V11.9z',
handleSize: '110%',
handleStyle: {
color: '#00a1ea',
shadowBlur: 3,
shadowColor: 'rgba(0,0,0,0.6)',
shadowOffsetX: 2,
shadowOffsetY: 2
},
fillerColor: 'rgba(255,255,255,0.1)',
borderColor: '#57617B',
backgroundColor: 'rgba(255,255,255,0.05)',
textStyle: { color: '#F1F1F3' }
}, {
type: 'inside',
xAxisIndex: [0],
start: 20,
end: 80
}],
grid: {
left: '5%',
right: '5%',
bottom: '18%',
top: '25%',
containLabel: true
},
xAxis: {
type: 'category',
boundaryGap: false,
data: xData,
axisLine: {
lineStyle: {
color: '#57617B',
width: 2
}
},
axisLabel: {
color: "rgba(255,255,255,.8)",
fontSize: 11,
fontWeight: 500,
rotate: 45
},
axisTick: {
lineStyle: {
color: '#57617B',
width: 1.5
}
},
splitLine: {
show: true,
lineStyle: {
color: "rgba(255,255,255,0.08)",
type: 'dashed'
}
}
},
yAxis: {
type: 'value',
name: '接口数量',
nameTextStyle: {
color: '#F1F1F3',
fontSize: 13,
fontWeight: 500
},
axisTick: { show: false },
axisLine: {
lineStyle: {
color: '#57617B',
width: 2
}
},
axisLabel: {
margin: 12,
color: "rgba(255,255,255,.7)",
fontSize: 12,
fontWeight: 500
},
splitLine: {
lineStyle: {
color: "rgba(255,255,255,0.08)",
type: 'dashed'
}
}
},
series: [{
name: '接口变化趋势',
type: 'line',
smooth: true,
symbol: 'circle',
symbolSize: 6,
lineStyle: {
width: 4,
color: {
type: 'linear',
x: 0, y: 0, x2: 1, y2: 1,
colorStops: [
{ offset: 0, color: '#3a76f6' },
{ offset: 0.25, color: '#66d4fa' },
{ offset: 0.5, color: '#f8d470' },
{ offset: 0.75, color: '#ff9a56' },
{ offset: 1, color: '#ec637b' }
],
global: false
},
shadowColor: 'rgba(58,118,246,0.3)',
shadowBlur: 10,
shadowOffsetY: 4
},
itemStyle: {
color: '#66d4fa',
borderColor: 'rgba(255,255,255,0.9)',
borderWidth: 2
},
areaStyle: {
color: {
type: 'linear',
x: 0, y: 0, x2: 0, y2: 1,
colorStops: [
{ offset: 0, color: 'rgba(236,99,123,0.4)' },
{ offset: 0.5, color: 'rgba(102,212,250,0.2)' },
{ offset: 1, color: 'rgba(102,212,250,0)' }
]
}
},
data: yData,
markLine: {
symbol: ['none', 'none'],
data: [
{
name: '峰值',
xAxis: '2-17',
label: {
show: true,
position: 'top',
backgroundColor: 'rgba(58,118,246,0.9)',
borderRadius: 5,
padding: [6, 12],
color: '#fff',
fontSize: 12,
fontWeight: 600,
formatter: '峰值\n75'
},
lineStyle: {
width: 2,
color: '#3a76f6',
type: 'dashed'
}
},
{
name: '归零',
xAxis: '3-05',
label: {
show: true,
position: 'top',
backgroundColor: 'rgba(102,207,239,0.9)',
borderRadius: 5,
padding: [6, 12],
color: '#fff',
fontSize: 12,
fontWeight: 600,
formatter: '归零'
},
lineStyle: {
width: 2,
color: '#66cfef',
type: 'dashed'
}
}
]
}
}]
};
完整示例代码
相关文件下载地址


