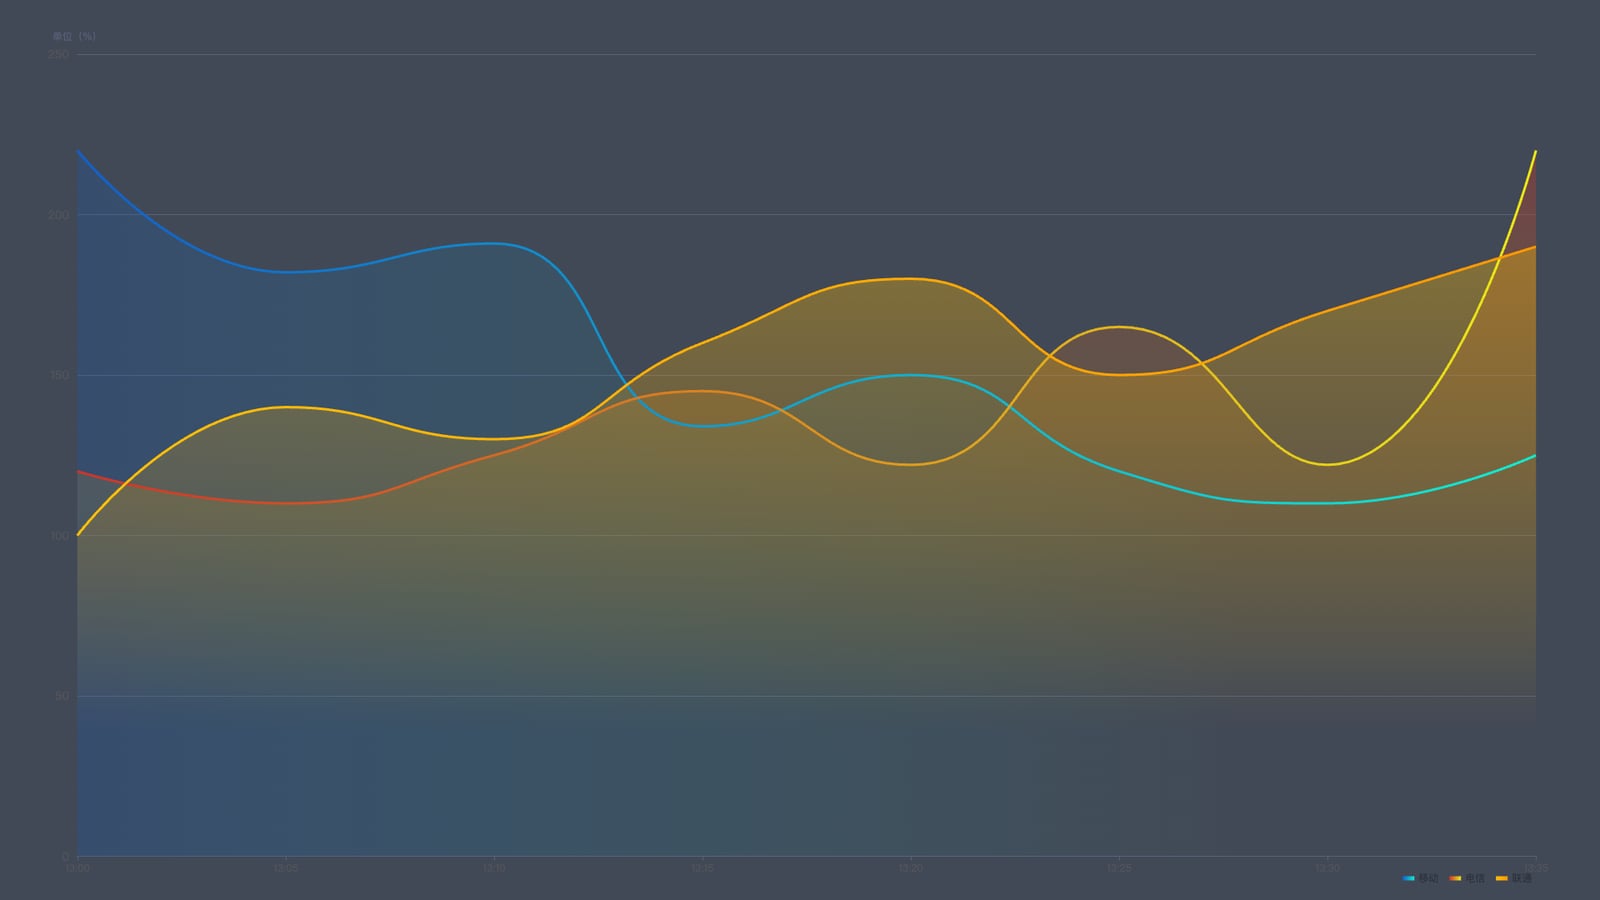
echarts折线图颜色渐变效果

echarts折线图

echarts折线图颜色渐变效果

ID

12

配置代码

const option = {
        backgroundColor: '#424956',
        tooltip: {
            trigger: 'axis',
            axisPointer: {
                lineStyle: {
                    color: '#57617B'
                }
            }
        },
        legend: {
            icon: 'rect',
            itemWidth: 14,
            itemHeight: 5,
            itemGap: 13,
            data: ['移动', '电信', '联通'],
            right: '4%',
            textStyle: {
                fontSize: 12,
                color: '#292f39'
            }
        },
        grid: {
            left: '3%',
            right: '4%',
            bottom: '3%',
            containLabel: true
        },
        xAxis: [{
            type: 'category',
            boundaryGap: false,
            axisLine: {
                lineStyle: {
                    color: '#57617B'
                }
            },
            data: ['13:00', '13:05', '13:10', '13:15', '13:20', '13:25', '13:30', '13:35']
        }],
        yAxis: [{
            type: 'value',
            name: '单位(%)',
            axisTick: {
                show: false
            },
            axisLine: {
                lineStyle: {
                    color: '#57617B'
                }
            },
            axisLabel: {
                margin: 10,
                textStyle: {
                    fontSize: 14
                }
            },
            splitLine: {
                lineStyle: {
                    color: '#57617B'
                }
            }
        }],
        series: [{
            name: '移动',
            type: 'line',
            smooth: true,
            symbol: 'circle',
            symbolSize: 5,
            showSymbol: false,
            lineStyle: {
                normal: {
                    width: 3
                }
            },
            areaStyle: {
                normal: {
                    color: new echarts.graphic.LinearGradient(0, 0, 1, 0, [{
                        offset: 0,
                        color: 'rgba(16,97,204, 0.3)'
                    }, {
                        offset: 0.8,
                        color: 'rgba(17,235,210, 0)'
                    }], false),
                    shadowColor: 'rgba(0, 0, 0, 0.1)',
                    shadowBlur: 10
                }
            },
            itemStyle: {
                normal: {
                    color: new echarts.graphic.LinearGradient(0, 0, 1, 0, [{
                        offset: 0,
                        color: 'rgba(16,97,204,1)'
                    }, {
                        offset: 1,
                        color: 'rgba(17,235,210,1)'
                    }])
                },
                emphasis: {
                    color: 'rgb(0,196,132)',
                    borderColor: 'rgba(0,196,132,0.2)',
                    extraCssText: 'box-shadow: 8px 8px 8px rgba(0, 0, 0, 1);',
                    borderWidth: 10
                }
            },
            data: [220, 182, 191, 134, 150, 120, 110, 125]
        }, {
            name: '电信',
            type: 'line',
            smooth: true,
            symbol: 'circle',
            symbolSize: 5,
            showSymbol: false,
            lineStyle: {
                normal: {
                    width: 3
                }
            },
            areaStyle: {
                normal: {
                    color: new echarts.graphic.LinearGradient(0, 0, 0, 1, [{
                        offset: 0,
                        color: 'rgba(205,52,42, 0.5)'
                    }, {
                        offset: 0.8,
                        color: 'rgba(235,235,21, 0)'
                    }], false),
                    shadowColor: 'rgba(0, 0, 0, 0.1)',
                    shadowBlur: 10
                },
            },
            itemStyle: {
                normal: {
                    color: new echarts.graphic.LinearGradient(0, 0, 1, 0, [{
                        offset: 0,
                        color: 'rgba(205,52,42,1)'
                    }, {
                        offset: 1,
                        color: 'rgba(235,235,21,1)'
                    }])
                },
                emphasis: {
                    color: 'rgb(99,250,235)',
                    borderColor: 'rgba(99,250,235,0.2)',
                    extraCssText: 'box-shadow: 8px 8px 8px rgba(0, 0, 0, 1);',
                    borderWidth: 10
                }
            },
            data: [120, 110, 125, 145, 122, 165, 122, 220]
        }, {
            // 添加联通数据(补全3条线)
            name: '联通',
            type: 'line',
            smooth: true,
            symbol: 'circle',
            symbolSize: 5,
            showSymbol: false,
            lineStyle: {
                normal: {
                    width: 3
                }
            },
            areaStyle: {
                normal: {
                    color: new echarts.graphic.LinearGradient(0, 0, 0, 1, [{
                        offset: 0,
                        color: 'rgba(255,193,7, 0.5)'
                    }, {
                        offset: 0.8,
                        color: 'rgba(255,152,0, 0)'
                    }], false),
                    shadowColor: 'rgba(0, 0, 0, 0.1)',
                    shadowBlur: 10
                },
            },
            itemStyle: {
                normal: {
                    color: new echarts.graphic.LinearGradient(0, 0, 1, 0, [{
                        offset: 0,
                        color: 'rgba(255,193,7,1)'
                    }, {
                        offset: 1,
                        color: 'rgba(255,152,0,1)'
                    }])
                },
                emphasis: {
                    color: 'rgb(76,175,80)',
                    borderColor: 'rgba(76,175,80,0.2)',
                    extraCssText: 'box-shadow: 8px 8px 8px rgba(0, 0, 0, 1);',
                    borderWidth: 10
                }
            },
            data: [100, 140, 130, 160, 180, 150, 170, 190]
        }]
    };

完整示例代码

相关文件下载地址
喜欢
echarts折线图颜色渐变效果