代码
<template>
<div class="echarts1" ref="echarts1">
</div>
</template>
<script>
export default {
name: 'echarts1',
components: {},
data() {
return {}
},
mounted() {
this.drawLine()
},
methods: {
drawLine() {
var that = this;
window.addEventListener('resize', this.drawLine)
let myChart = this.$echarts.init(this.$refs.echarts1)
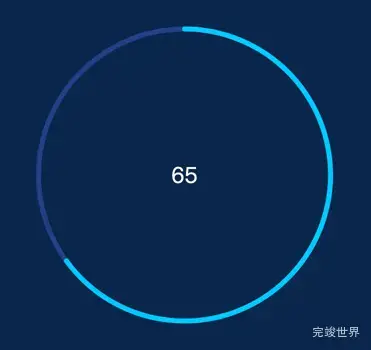
var option = {
title: {
text: "65",
textStyle: {
color: "rgba(255, 255, 255, 1)",
fontSize: 22,
fontWeight: "400",
},
// subtext: "已处理数",
// subtextStyle: {
// color: "rgba(150, 175, 220, 1)",
// fontSize: 13,
// fontWeight: "100",
// },
itemGap: -10,
left: "center",
top: "center",
},
angleAxis: {
max: 100,
clockwise: true,
axisLine: {
show: false,
},
axisTick: {
show: false,
},
axisLabel: {
show: false,
},
splitLine: {
show: false,
},
},
radiusAxis: {
type: "category",
axisLine: {
show: false,
},
axisTick: {
show: false,
},
axisLabel: {
show: false,
},
splitLine: {
show: false,
},
},
polar: {
center: ["50%", "50%"],
radius: "150%",
},
series: [
{
type: "bar",
data: [
{
name: "Total Downloads",
value: 65,
itemStyle: {
normal: {
color: "#02CBFF",
},
},
},
],
coordinateSystem: "polar",
roundCap: true,
barWidth: 5,
barGap: "0%",
z: 2,
},
{
type: "bar",
data: [
{
value: 100,
itemStyle: {
color: "#204187",
shadowColor: "rgba(0, 0, 0, 0.2)",
shadowBlur: 0,
shadowOffsetY: 0,
},
},
],
coordinateSystem: "polar",
roundCap: true,
barWidth: 5,
barGap: "-100%",
z: 1,
},
],
};
myChart.clear()
myChart.resize()
myChart.setOption(option)
},
}
}
</script>
<style lang="scss" scoped>
.echarts1 {
position: relative;
width: 100%;
height: calc(100% - 10px);
}
</style>