echarts柱状图数量过多,我们需要通过鼠标滚轮来切换数据,滚轮切换有横向和纵向之分。
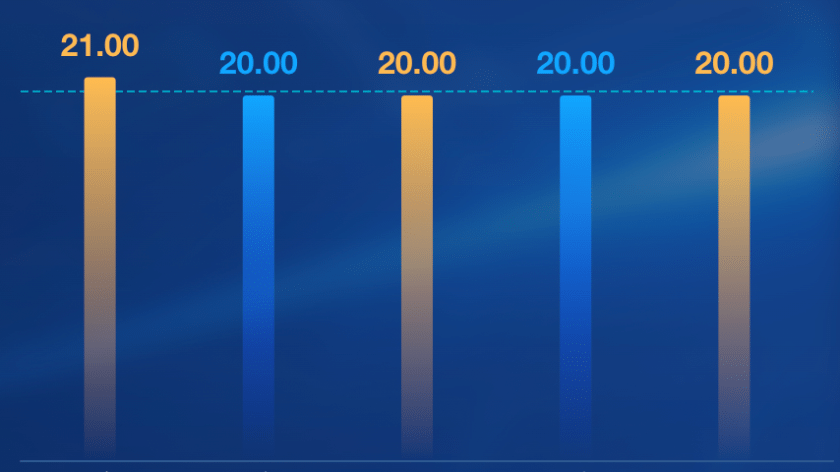
水平方向实例代码
水平方向鼠标滚轮切换数据,我们通过xAxisIndex来指定dataZoom为x轴。
dataZoom: [
{
  type: 'slider',
  xAxisIndex: [0,1, 2],
  zoomLock: true,
  startValue: 0,
  endValue: 4,
  show: false,
  zoomOnMouseWheel: false,
  moveOnMouseWheel: true,
  moveOnMouseMove: true
},
{
  type: 'inside',
  xAxisIndex: [0,1, 2],
  startValue: 0,
  endValue: 4,
  zoomOnMouseWheel: false,
  moveOnMouseWheel: true,
  moveOnMouseMove: true
}
],
垂直方向滚轮切换
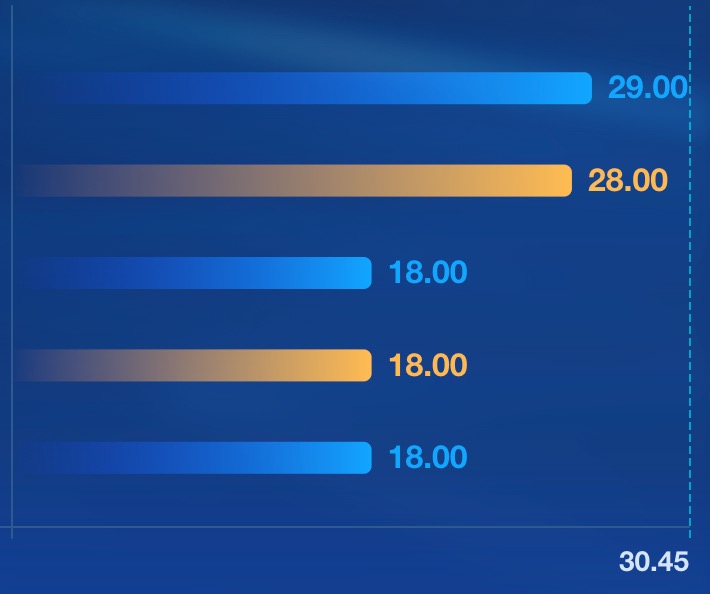
纵向数据切换 我们通过yAxisIndex来指定dataZoom为y轴,后面的数据是我们可以控制的y轴的下标。
dataZoom: [
{
  type: 'slider',
  yAxisIndex: [0, 2],
  zoomLock: true,
  start: 100 - Math.floor((100 / _this.yAxisLine.resultList.length) * 5), // 显示最后5条数据
  show: false,
  end: 100,
  zoomOnMouseWheel: false,
  moveOnMouseWheel: true,
  moveOnMouseMove: true
},
{
  type: 'inside',
  yAxisIndex: [0, 2],
  start: 100 - Math.floor((100 / _this.yAxisLine.resultList.length) * 5), // 显示最后5条数据
  end: 100,
  zoomOnMouseWheel: false,
  moveOnMouseWheel: true,
  moveOnMouseMove: true
}
],


