echarts大屏项目开发中,需要实现一个功能,饼状图点击扇形区域后对应的自定义lengend高亮,点击自定义lengend后,对应的扇形区域高亮。
动态效果
echarts相关代码
<template>
  <div class="echartsBody">
    <div class="echartsBody1" ref="echarts1"></div>
    <div class="echartsBody2" v-if="num">
      <div class="echartsTitle">
        <gsapNum :number="num"></gsapNum>
      </div>
    </div>
  </div>
</template>

<script>
import * as echarts from "echarts"
import gsapNum from "@/components/gsapNum/index.vue";

export default {
  name: 'echarts1',
  components: {gsapNum},
  data() {
    return {
      num: 0,
      name: ''
    }
  },
  props: {
    list: {
      type: Array,
      default() {
        return [];
      }
    },
    shadowColor: {
      type: String,
      default() {
        return 'rgba(254, 175, 87, 0.5)';
      }
    },
    title: {
      type: String,
      default() {
        return '总数';
      }
    },
    total: {
      type: String,
      default() {
        return 0;
      }
    },
  },
  mounted() {
    var that = this;
    const viewElem = document.body;
    // 监听窗口变化,重绘echarts
    const resizeObserver = new ResizeObserver(() => {
      setTimeout(() => {
        that.drawEcharts();
      }, 300)
    });
    resizeObserver.observe(viewElem);
  },
  computed: {
    colorList: function () {
      var that = this;
      var colorList = []
      that.list.forEach((type) => {
        var color = new echarts.graphic.LinearGradient(0, 0, 1, 1, [{
          offset: 0,
          color: type.color1
        }, {
          offset: 1,
          color: type.color2
        }])
        colorList.push(color)
      });
      return colorList
    }
  },
  watch: {
    list() {
      this.drawEcharts()
    },
    name(newName, oldName) {
      let index = this.list.findIndex(item => item.name === newName);
      if (index !== -1) {
        let myChart = echarts.init(this.$refs.echarts1);
        // 取消之前高亮的扇形区域
        myChart.dispatchAction({
          type: 'downplay',
          seriesIndex: 0
        });

        // 高亮当前点击的扇形区域
        myChart.dispatchAction({
          type: 'highlight',
          seriesIndex: 0,
          dataIndex: index
        });
      }
    },
  },
  methods: {
    getName(e) {
      this.name = e
      this.list.forEach((type, index) => {
        if (type.name == e) {
          this.num = type.value
        }
      })
    },
    drawEcharts() {
      var that = this
      let myChart = echarts.init(this.$refs.echarts1)
      window.addEventListener('resize', function () {
        that.drawEcharts()
      })
      var colors = this.colorList
      var data = []
      var maxIndex = 0
      var maxValue = 0
      that.list.forEach((type, index) => {
        if (type.checked) {
          var datas = {
            ...type,
            itemStyle: {
              normal: {
                borderColor: new echarts.graphic.LinearGradient(0, 0, 1, 1, [{
                  offset: 0,
                  color: type.color1
                }, {
                  offset: 1,
                  color: type.color2
                }]),
              }
            }
          }
          data.push(datas)
          if (type.value > maxValue) {
            maxValue = type.value
            maxIndex = index
            that.name = type.name
            that.num = type.value
            that.$emit('getName', that.name);
          }
        }
      });
      var option = {
        color: colors,
        tooltip: {
          trigger: 'item',
          backgroundColor: 'rgba(0, 0, 0, 0)', // 设置 tooltip 背景色为透明
          borderColor: 'rgba(0, 0, 0, 0)',
          opacity: 1,
          shadowColor: 'rgba(0, 0, 0, 0)', // 设置阴影颜色为透明
          shadowBlur: 0, // 设置阴影模糊度为0,即无阴影
          confine: true,
          // 使用自定义的 formatter 函数
          formatter: function (params) {
            // params 是一个包含了当前鼠标悬浮点的所有数据的对象
            return `
                <div class="tooltipWin">
                  <h4 class="tooltipTitle">${params.name}</h4>
                  <p>件数:  <span>${params.value}</span></p>
                  <p>百分比: <span>${params.percent}%</span></p>
                </div>
                `;

          }
        },
        series: [
          {
            name: '案件类别',
            type: 'pie',
            roundCap: true,
            radius: ['50%', '80%'],
            center: ['50%', '50%'],
            borderCap: 'round',
            label: {
              show: false,
              position: 'center',
              formatter: function (data) {
                return data.value;
              },
              textStyle: {
                fontSize: 36,
                fontFamily: 'D-DIN, D-DIN',
                fontWeight: 'bold',
                color: '#FDBA51'
              }
            },
            labelLine: {
              show: false,
              length: 1,
              length2: 10
            },
            data: data
          },
        ]
      }
      myChart.clear()
      myChart.resize()
      myChart.setOption(option)
      myChart.dispatchAction({
        type: 'highlight',
        seriesIndex: 0,
        dataIndex: maxIndex
      });
      myChart.on('click', function (param) {
        // 取消之前高亮的扇形区域
        myChart.dispatchAction({
          type: 'downplay',
          seriesIndex: 0
        });

        // 高亮当前点击的扇形区域
        myChart.dispatchAction({
          type: 'highlight',
          seriesIndex: 0,
          dataIndex: param.dataIndex
        });
        console.log(param)
        that.num = param.value
        that.name = param.name
        that.$emit('getName', param.name);
      });
    },
  }
}
</script>

<style lang="scss" scoped>
.echartsBody {
  position: relative;
  width: 50%;
  height: calc(100% - 0px);

  .echartsBody1 {
    position: relative;
    width: 100%;
    height: calc(100% - 0px);
  }

  .echartsBody2 {
    position: absolute;
    top: 0;
    left: 0;
    width: 100%;
    height: calc(100% - 0px);
    display: flex;
    justify-content: center;
    align-items: center;
    flex-wrap: nowrap;
    flex-direction: column;
    align-content: flex-start;
    pointer-events: none;

    .echartsTitle {
      font-size: 36px;
      font-family: DIN-Bold;
      font-weight: bold;
      font-style: normal;
      color: #FDBA51;
    }
  }
}

</style>
<style lang="scss">
.tooltipWin {
  background: rgba(0, 0, 0, 0.8);
  padding: 10px;

  .tooltipTitle {
    font-size: 16px;
    font-family: MicrosoftYaHeiSemibold;
    color: #FFFFFF;
    padding: 0;
    margin: 0;
  }

  p {
    font-size: 16px;
    font-family: MicrosoftYaHeiSemibold;
    color: #FFFFFF;
    padding: 0;
    margin: 0;

    span {
      font-size: 16px;
      font-family: MicrosoftYaHeiSemibold;
      color: #02E9F1;
    }
  }
}
</style>
自定义lengend相关代码
<template>
<div class="echartsBodys">
<echarts1 @getName="getName" title="总数" :total="total" :list="list" ref="echarts"></echarts1>
<div class="list">
<div class="listItem cur" @click="getChecked(item.name)" :class="{active:item.name==name}"
v-for="(item,index) in list" :key="index">
<div class="listIteml">
<div class="dot"
:style="'background: linear-gradient(80deg,'+item.color1+' 0%, '+item.color2+' 100%);'"></div>
<span>{{ item.name }}</span>
</div>
<div class="listItemr">
<em class="num">{{
item.value
}}</em>
</div>
</div>
</div>
</div>
</template>
<script>
import echarts1 from "./components/echarts.vue";
export default {
name: "title",
data() {
return {
name: '',
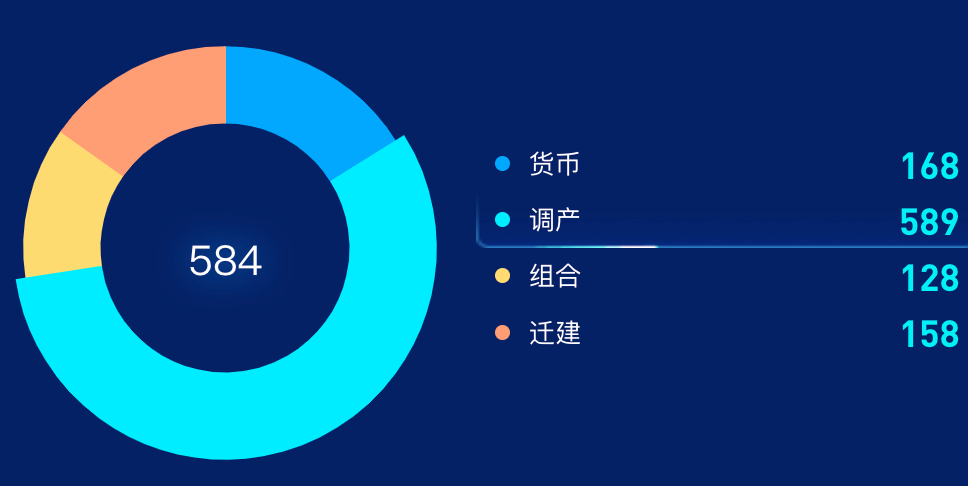
list: [
{
name: '货币',
value: 168,
color1: 'rgba(0, 168, 255, 1)',
color2: 'rgba(0, 168, 255, 1)',
checked: true
},
{
name: '调产',
value: 589,
color1: 'rgba(0, 238, 255, 1)',
color2: 'rgba(0, 238, 255, 1)',
checked: true
},
{
name: '组合',
value: 128,
color1: 'rgba(255, 219, 113, 1)',
color2: 'rgba(255, 219, 113, 1)',
checked: true
},
{
name: '迁建',
value: 158,
color1: 'rgba(255, 158, 116, 1)',
color2: 'rgba(255, 158, 116, 1)',
checked: true
}]
}
},
computed: {
total: function () {
var total = 0
this.list.forEach((type) => {
total += type.value
});
return total
}
},
components: {echarts1},
methods: {
getChecked(name) {
this.name = name
this.$refs.echarts.getName(name)
},
getName(e) {
this.name = e
this.$emit('getName', e)
}
},
}
</script>
<style lang="scss" scoped>
.list {
position: relative;
width: calc(50% - 0px);
margin-left: 0px;
height: calc(100% - 0px);
display: flex;
justify-content: center;
align-items: center;
flex-wrap: wrap;
flex-direction: column;
align-content: flex-start;
.listItem {
font-size: 14px;
display: flex;
height: 30px;
margin-left: 0px;
width: calc(100% - 0px);
justify-content: space-between;
align-items: center;
flex-wrap: nowrap;
flex-direction: row;
align-content: flex-start;
cursor: pointer;
.listIteml {
display: flex;
justify-content: flex-start;
align-items: center;
flex-wrap: nowrap;
flex-direction: row;
align-content: flex-start;
font-size: 14px;
font-family: MicrosoftYaHei;
font-weight: 400;
color: #FFFFFF;
padding-left: 10px;
}
.listItemr {
display: flex;
justify-content: flex-end;
align-items: center;
flex-wrap: nowrap;
flex-direction: row;
align-content: flex-start;
padding-right: 10px;
span {
font-size: 14px;
font-family: PingFang SC-Regular, PingFang SC;
font-weight: 400;
color: rgba(255, 255, 255, 1);
}
p {
font-size: 14px;
font-family: MicrosoftYaHeiSemibold;
color: #FFFFFF;
margin-left: 4px;
}
}
.dot {
width: 8px;
height: 8px;
margin-right: 10px;
flex-shrink: 0;
border-radius: 50%;
}
.dot.disabled {
background: rgba(#999, 0.8) !important;
}
span.disabled {
color: rgba(#999, 0.8) !important;
}
.num {
font-size: 20px;
font-family: DIN-Bold;
font-weight: bold;
color: #00F1F7;
font-style: normal;
}
}
.listItem.active {
background: url("./components/assets/bgAnimate.png") no-repeat;
background-size: 100% 100%;
}
}
.echartsBodys {
width: 100%;
position: relative;
height: 100%;
display: flex;
justify-content: center;
align-items: center;
flex-wrap: nowrap;
flex-direction: row;
align-content: flex-start;
}
</style>


