echarts 时间线样式参数调整,以及自定义上一个下一个按钮图标
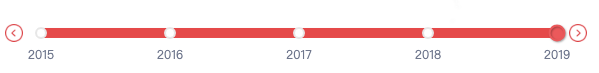
timeTitle: ['2015', '2016', '2017', '2018', '2019'],
import prevIcon from '../../assets/icon_leftjt.png'
import nextIcon from '../../assets/icon_rightjt.png'
timeline: {
  data: timeTitle,
  axisType: 'category',
  autoPlay: true,
  playInterval: 5000,
  left: '10%',
  right: '10%',
  bottom: '2%',
  width: '60%',
  label: {
    normal: {
      textStyle: {
        color: 'rgba(51, 51, 51, 1)'
      }
    },
    emphasis: {
      textStyle: {
        color: '#fff'
      }
    }
  },
  currentIndex: that.currentIndex,
  symbolSize: 10,
  lineStyle: {
    color: '#e7e7e7',
    width: 10,
  },
  itemStyle: {
    color: '#fff',
    borderWidth: 2,
    borderColor: '#e7e7e7'
  },
  progress: {
    lineStyle: {
      color: '#e54949'
    },
    itemStyle: {
      color: '#fff'
    }
  },
  checkpointStyle: {
    borderColor: '#eb595a',
    color: '#eb595a',
    borderWidth: 2,
  },
  controlStyle: {
    showNextBtn: true,
    showPrevBtn: true,
    prevIcon: 'image://' + prevIcon,
    nextIcon: 'image://' + nextIcon,
    normal: {
      color: 'rgba(218, 46, 46, 1)',
      borderColor: 'rgba(218, 46, 46, 1)'
    },
    emphasis: {
      color: '#ed5d5d',
      borderColor: '#ed5d5d'
    }
  },
},


