运行实例
代码
<template>
<div class="echarts1" ref="echarts1">
</div>
</template>
<script>
export default {
name: 'echarts1',
components: {},
data() {
return {}
},
mounted() {
this.drawLine()
},
methods: {
drawLine() {
var that = this;
window.addEventListener('resize', this.drawLine)
let myChart = this.$echarts.init(this.$refs.echarts1)
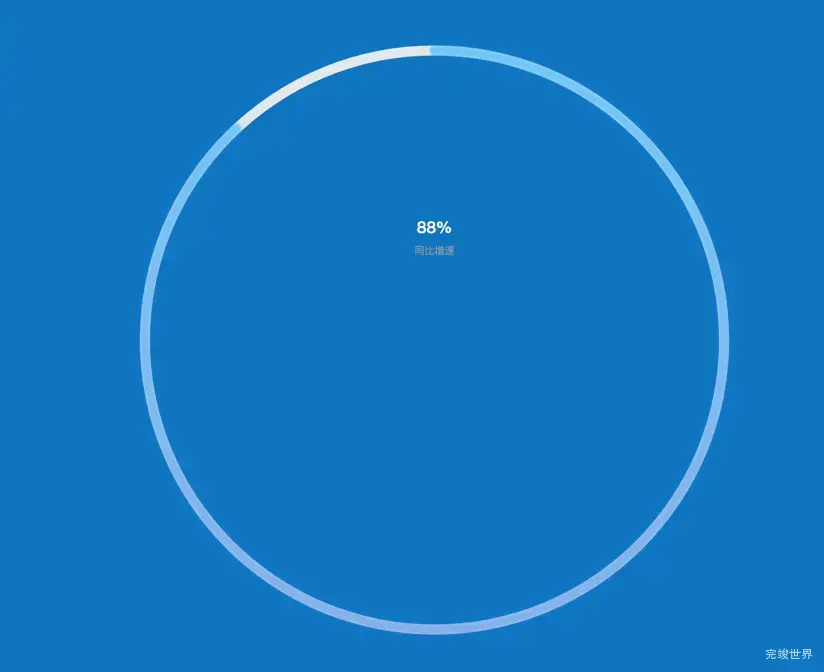
var getvalue = [88];
var option = {
title: {
text: getvalue + '%',
textStyle: {
color: '#fff',
fontSize: 16
},
subtext: '同比增速',
subtextStyle: {
color: '#999',
fontSize: 10
},
itemGap: 10,
left: 'center',
top: '37%'
},
tooltip: {
formatter: function (params) {
return '<span style="color: #fff;">同比增长:' + getvalue + '%</span>';
}
},
angleAxis: {
max: 100,
clockwise: true, // 逆时针
// 隐藏刻度线
show: false
},
radiusAxis: {
type: 'category',
show: true,
axisLabel: {
show: false,
},
axisLine: {
show: false,
},
axisTick: {
show: false
},
},
polar: {
center: ['50%', '50%'],
radius: '120%' //图形大小
},
series: [{
type: 'bar',
data: getvalue,
showBackground: true,
backgroundStyle: {
color: '#E2E7EC',
},
coordinateSystem: 'polar',
roundCap: true,
barWidth: 10,
itemStyle: {
normal: {
opacity: 1,
color: new that.$echarts.graphic.LinearGradient(0, 0, 0, 1, [{
offset: 0,
color: '#25BFFF'
}, {
offset: 1,
color: '#5284DE'
}]),
shadowBlur: 5,
shadowColor: '#2A95F9',
}
},
}]
};
myChart.clear()
myChart.resize()
myChart.setOption(option)
},
}
}
</script>
<style lang="scss" scoped>
.echarts1 {
position: relative;
width: 100%;
height: calc(100% - 10px);
}
</style>