echarts 渲染 geoJson GeometryCollection 类型数据报错
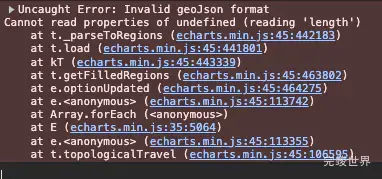
Invalid geoJson format Cannot read properties of undefined (reading 'length')
使用@turf/turf来处理数据
安装依赖
pnpm i @turf/turf
引入
import * as turf from "@turf/turf";
数据处理
function toSplit(map) {
    let tempArr = map.features.map(i => {
        if (i.geometry.type != "GeometryCollection") {
            return i;
        } else {
            return transFormGeoJson(i);
        }
    })
    return turf.featureCollection(tempArr);
    ;
}

function transFormGeoJson(map) {
    // 将GeometryCollection类型转换为MultiPolygon类型
    const multiPolygon = turf.multiPolygon(
        map.geometry.geometries.map((geometry) => {
            return geometry.coordinates;
        })
    );
    multiPolygon.properties = map.properties;
    return multiPolygon;
}

function getEcharts(data) {
    var chartDom = document.getElementById('echarts');
    var myChart = echarts.init(chartDom);
    var nameMap = '地图数据';
    var mapData = []
    let map = eval(data);
    map = toSplit(map);
    echarts.registerMap(nameMap, map);
    /*获取地图数据*/
    myChart.showLoading();
    var mapFeatures = echarts.getMap(nameMap).geoJson.features;
    myChart.hideLoading();
    mapFeatures.forEach(function (v, index) {
        // 地区名称
        mapData.push({
            name: v.properties.name,
            value: Math.random() * 100
        });
    });
    var serverdata = [
        { // 地图块的相关信息
            type: 'map',
            map: nameMap,
            zoom: 1.2,
            roam: false,
            selectedMode: "single",
            showLegendSymbol: false,
            visibility: "off",
            label: {
                show: false,
                normal: {
                    show: true,
                    textStyle: {
                        fontSize: 12,
                        fontWeight: 400,
                        color: '#fff'
                    }
                }
            },
            data: mapData
        }
    ]
    var optionMap = {
        toolbox: {
            show: true,
            feature: {
                saveAsImage: {
                    show: true,
                    excludeComponents: ['toolbox'],
                    pixelRatio: 1
                }
            }
        },
        visualMap: {
            type: "piecewise",
            pieces: [
                {max: 30, label: "安全", color: "#2c9a42"},
                {min: 30, max: 60, label: "警告", color: "#d08a00"},
                {min: 60, label: "危险", color: "#c23c33"},
            ],
            color: "#fff",
            textStyle: {
                color: "#fff",
            },
            visibility: "off",
        },
        geo: {
            map: nameMap,
            show: false,
            roam: true,
            label: {
                normal: {
                    show: true
                },
                emphasis: {
                    show: false
                }
            }
        },
        series: serverdata
    };
    myChart.setOption(optionMap);
}


