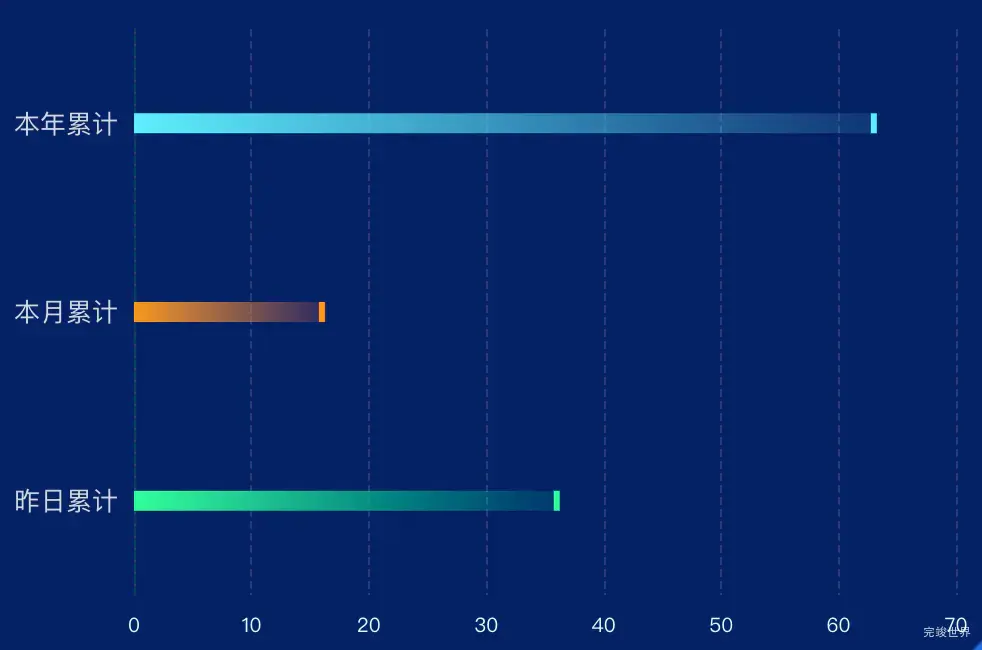
数据大屏项目开发中,我们需要实现自定义颜色的横向柱状图,每个柱状图顶部都有一个帽子,帽子的颜色要和柱状图主体色一致。
实现代码
<template>
  <div class="echarts1" ref="echarts">
  </div>
</template>
<script>
import * as echarts from "echarts"
import dayjs from 'dayjs'

export default {
  name: 'echarts1',
  data() {
    return {
      list: [],
      colorList: [{
        color1: 'rgba(0, 255, 156, 1)',
        color2: 'rgba(0, 255, 156, 0.1)',
      }, {
        color1: 'rgba(249, 152, 25, 1)',
        color2: 'rgba(249, 152, 25, 0.1)',
      }, {
        color1: 'rgba(94, 238, 255, 1)',
        color2: 'rgba(94, 238, 255, 0.1)',
      },]
    }
  },
  watch: {
    active() {
      this.getData()
    },
  },
  props: {
    active: {
      type: [String, Number],
      default() {
        return '';
      }
    }
  },
  mounted() {
    this.getData()
  },
  methods: {
    getData() {
      let data = [];
      let names = ['昨日累计', '本月累计', '本年累计'];

      for (let i = 0; i < names.length; i++) {
        let value = Math.floor(Math.random() * 100) + 1;
        data.push({
          name: names[i],
          value: value
        });
      }
      this.list = data;
      this.drawEcharts(); // 绘制图表
    },
    drawEcharts() {
      window.addEventListener('resize', this.drawEcharts)
      // 基于准备好的dom,初始化echarts实例
      let myChart = echarts.init(this.$refs.echarts)
      var option = {
        grid: {
          top: '20px',
          bottom: '10px',
          left: '20px',
          right: '20px',
          containLabel: true
        },
        tooltip: {
          trigger: 'axis',
          // backgroundColor: 'transparent',
          // borderColor: 'transparent',
//           formatter: function (params) {
//             let content = `<div class="tooltipBg">`;
//             console.log(params)
//             // 遍历所有数据点
//             params.forEach(param => {
//               // 添加图标、名称和值
//               content += `<div class="tooltipItem">
// <p>``{param.name}</p> : <span>``{param.value}</span>
// </div>`;
//             });
//             return content;
//           },
        },
        legend: {
          top: 0,
          right: 20,
          show: false,
          itemWidth: 10,
          itemHeight: 10,
          textStyle: {
            color: 'rgba(157, 185, 233, 1)',
            fontSize: '12'
          },
        },
        xAxis: [{
          type: 'value',
          axisLabel: {
            margin: 10,
            interval: 0,
            color: 'rgba(220, 254, 255, 1)',
            textStyle: {
              fontSize: 10,
              fontFamily: 'fengguangmingrui',
            },
          },
          axisLine: {
            lineStyle: {
              color: 'rgba(8, 61, 98, 1.00)',
              type: 'dashed',
              width: 1,
            }
          },
          splitLine: {
            show: true,
            lineStyle: {
              color: 'rgba(255, 255, 255, 0.12)',
              width: 1,
              type: 'dashed',
            }
          },
          axisTick: {
            show: false
          },
        }],

        yAxis: [
          {
            type: 'category',
            data: this.list.map(obj => obj.name),
            axisLabel: {
              color: 'rgba(204, 217, 229, 1)',
              textStyle: {
                fontSize: 13,
                fontFamily: 'fengguangmingrui',
              },
            },
            axisLine: {
              lineStyle: {
                color: 'rgba(8, 61, 98, 1.00)',
                type: 'dashed',
                width: 1,
              }
            },
            axisTick: {
              show: false
            },
            splitLine: {
              show: false,
              lineStyle: {
                color: 'rgba(8, 61, 98, 1.00)',
                type: 'dashed',
                width: 1,
              }
            }
          }],
        series: [
          {
            name: '发电量',
            type: 'bar',
            data: this.list.map(obj => obj.value),
            barWidth: '10',
            itemStyle: {
              normal: {
                color: (params) => {
                  let colorList = [{
                    color1: 'rgba(0, 255, 156, 1)',
                    color2: 'rgba(0, 255, 156, 0.1)',
                  }, {
                    color1: 'rgba(249, 152, 25, 1)',
                    color2: 'rgba(249, 152, 25, 0.1)',
                  }, {
                    color1: 'rgba(94, 238, 255, 1)',
                    color2: 'rgba(94, 238, 255, 0.1)',
                  },];
                  let index = params.dataIndex % colorList.length;
                  return new echarts.graphic.LinearGradient(0, 0, 1, 0, [{
                    offset: 0,
                    color: colorList[index].color1
                  }, {
                    offset: 1,
                    color: colorList[index].color2
                  }], false);
                },
              }
            },
            markPoint: {
              symbol: 'path://M62 62h900v900h-900v-900z', // 使用 SVG path 绘制扁圆形状
              symbolSize: [3, 10], // 设置扁圆的宽和高
              data: this.list.map((obj, index) => {
                let colorList = [{
                  color1: 'rgba(0, 255, 156, 1)',
                  color2: 'rgba(0, 255, 156, 0.1)',
                }, {
                  color1: 'rgba(249, 152, 25, 1)',
                  color2: 'rgba(249, 152, 25, 0.1)',
                }, {
                  color1: 'rgba(94, 238, 255, 1)',
                  color2: 'rgba(94, 238, 255, 0.1)',
                },];
                let colorIndex = index % colorList.length;
                return {
                  yAxis: index, // 对应柱子的横坐标
                  xAxis: obj.value + 0, // 柱子的值加上一些偏移量
                  name: index, // 添加这个属性
                  itemStyle: {
                    color: colorList[colorIndex].color1, // 直接设置颜色
                  },
                };
              })
            }
          }
        ]
      }
      myChart.clear()
      myChart.resize()
      myChart.setOption(option)
    },
  }
}
</script>

<style lang="scss" scoped>
.echarts1 {
  position: relative;
  width: 100%;
  height: 100%;
}
</style>


