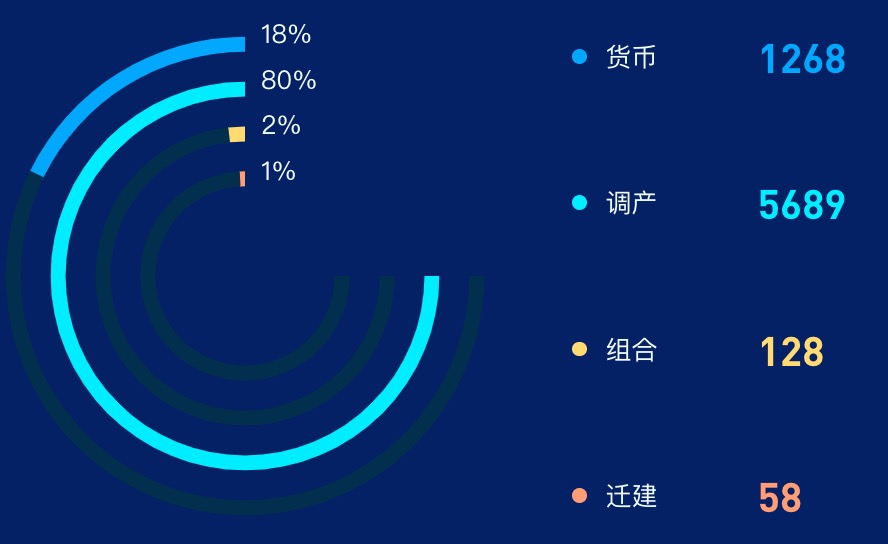
echarts项目开发中,需要实现多个环形进度条的效果,类似下图,环形进度条只会渲染四分之三的区域最后的四分之一的区域显示label描述,但是在实际渲染的时候,会遇到当其中一个数字太大占比超过75的时候,进度条会超出75%我们需要限制其最大不能超出75%,且lable正常显示。
实例代码
<template>
  <div class="echarts1" ref="echarts1">

  </div>
</template>

<script>

import * as echarts from "echarts"

export default {
  name: 'echarts1',
  components: {},
  data() {
    return {}
  },
  props: {
    list: {
      type: Array,
      default() {
        return [];
      }
    },
    name: {
      type: String,
      default() {
        return '';
      }
    },
  },
  watch: {
    list() {
      this.drawEcharts()
    },
  },
  mounted() {
    var that = this;
    const viewElem = document.body;
    // 监听窗口变化,重绘echarts
    const resizeObserver = new ResizeObserver(() => {
      setTimeout(() => {
        that.drawEcharts();
      }, 300)
    });
    resizeObserver.observe(viewElem);
  },
  methods: {
    drawEcharts() {
      var that = this;
      let myChart = echarts.init(this.$refs.echarts1)
      let maxRadius = 80,
          barWidth = 5,
          barGap = 10;
      var arrValue = getArrayValue(this.list, "value");
      var sumValue = eval(arrValue.join('+'));
      var optionData = getData(this.list);

      function getArrayValue(array, key) {
        var key = key || "value";
        var res = [];
        if (array) {
          array.forEach(function (t) {
            res.push(t[key]);
          });
        }
        return res;
      }
      function getData(data) {
        var res = {
          series: [],
          yAxis: []
        };
        var maxDisplayPercentage = 0.75; // 最大显示占比为75%

        data.forEach((item, index) => {
          var itemPercentage = item.value / sumValue; // 计算每个项目的实际占比
          // var displayPercentage = Math.min(itemPercentage, maxDisplayPercentage); // 计算显示占比,不超过75%

          var displayPercentage = itemPercentage * maxDisplayPercentage; // 实际数据乘以0.75

          // 添加灰色背景部分
          res.series.push({
            name: '',
            type: 'pie',
            clockWise: false,
            hoverAnimation: false,
            radius: [(maxRadius - index * (barGap + barWidth)) + '%', (maxRadius - (index + 1) * barWidth - index * barGap) + '%'],
            center: ["50%", "50%"],
            label: {
              show: false
            },
            itemStyle: {
              borderWidth: 5
            },
            data: [{
              value: 7.5,
              itemStyle: {
                color: '#032f4e',
              },
              tooltip: {
                show: false
              },
              hoverAnimation: false
            },
              {
                value: 2.5,
                itemStyle: {
                  color: "rgba(0,0,0,0)",
                  borderWidth: 0
                },
                tooltip: {
                  show: false
                },
                hoverAnimation: false
              }
            ]
          });

          res.series.push({
            name: '安置方法',
            type: 'pie',
            clockWise: false,
            hoverAnimation: false,
            radius: [(maxRadius - index * (barGap + barWidth)) + '%', (maxRadius - (index + 1) * barWidth - index * barGap) + '%'],
            center: ["50%", "50%"],
            label: {
              show: false
            },
            itemStyle: {
              label: {
                show: false,
              },
              labelLine: {
                show: false
              },
              borderWidth: 5,
            },
            data: [{
              value: displayPercentage * 100, // 使用限制后的显示占比
              name: item.name
            }, {
              value: (1 - displayPercentage) * 100, // 剩余部分
              name: '',
              itemStyle: {
                color: "rgba(0,0,0,0)",
                borderWidth: 0
              },
              tooltip: {
                show: false
              },
              hoverAnimation: false
            }]
          });

          // y轴数据使用实际数值占比
          res.yAxis.push((itemPercentage * 100).toFixed(0) + "%");
        });

        return res;
      }

      var option = {
        tooltip: {
          show: false,
          trigger: "item",
          formatter: "{a}<br>{b}:{c}({d}%)"
        },
        color: this.list.map(obj => obj.color1),
        grid: {
          top: '8%',
          bottom: '63%',
          left: "50%",
          containLabel: false
        },
        yAxis: [{
          type: 'category',
          inverse: true,
          axisLine: {
            show: false
          },
          axisTick: {
            show: false
          },
          axisLabel: {
            interval: 0,
            inside: true,
            textStyle: {
              color: "rgba(235, 255, 255, 1)",
              fontSize: 13,
            },
            show: true
          },
          data: optionData.yAxis
        }],
        xAxis: [{
          show: false
        }],
        series: optionData.series
      };
      myChart.clear()
      myChart.resize()
      myChart.setOption(option)
    },
  }
}
</script>

<style lang="scss" scoped>
.echarts1 {
  position: relative;
  width: 60%;
  height: calc(100% - 10px);
}
</style>
使用实例
<template>
  <div class="echartsBodys">
    <echarts1 name="安置方法" :total="total" :list="list" ref="echarts"></echarts1>
    <div class="list">
      <div class="listItem cur" @click="getChecked(index)" v-for="(item,index) in list" :key="index">
        <div class="listIteml">
          <div class="dot" :class="{disabled:!item.checked}"
               :style="'background: linear-gradient(80deg,'+item.color1+' 0%, '+item.color2+' 100%);'"></div>
          <span :class="{disabled:!item.checked}">{{ item.name }}</span>
        </div>
        <em class="num"
            :style="{ color: item.checked ? item.color1 : '' }"
            v-if="item.checked">{{
            item.value
          }}</em>
        <em class="num"
            :style="{ color: item.checked ? item.color1 : '' }"
            v-else>{{
            item.value
          }}</em>
      </div>
    </div>
  </div>
</template>

<script>
import echarts1 from "./components/echarts.vue";

export default {
  name: "title",
  data() {
    return {
      list: [
        {
          name: '货币',
          value: 1268,
          color1: 'rgba(0, 168, 255, 1)',
          color2: 'rgba(0, 168, 255, 1)',
          checked: true
        },
        {
          name: '调产',
          value: 5689,
          color1: 'rgba(0, 238, 255, 1)',
          color2: 'rgba(0, 238, 255, 1)',
          checked: true
        },
        {
          name: '组合',
          value: 128,
          color1: 'rgba(255, 219, 113, 1)',
          color2: 'rgba(255, 219, 113, 1)',
          checked: true
        },
        {
          name: '迁建',
          value: 58,
          color1: 'rgba(255, 158, 116, 1)',
          color2: 'rgba(255, 158, 116, 1)',
          checked: true
        }]
    }
  },
  computed: {
    total: function () {
      var total = 0
      this.list.forEach((type) => {
        total += type.value
      });
      return total
    }
  },
  components: {echarts1},
  methods: {
    getChecked(index) {
      this.list[index].checked = !this.list[index].checked
      this.$refs.echarts.drawEcharts()
    }
  },
}
</script>

<style lang="scss" scoped>
.list {
  margin-left: 0px;
  position: relative;
  width: calc(40% - 0px);
  margin-right: 0px;
  height: calc(90% - 0px);
  margin-top: 0%;
  display: flex;
  justify-content: space-between;
  align-items: center;
  flex-wrap: nowrap;
  flex-direction: column;
  align-content: flex-start;

  .listItem {
    font-size: 14px;
    display: flex;
    height: 30%;
    width: calc(100% - 30px);
    margin: 0 auto;
    justify-content: flex-start;
    align-items: center;
    flex-wrap: nowrap;
    flex-direction: row;
    align-content: flex-start;

    .listIteml {
      display: flex;
      justify-content: flex-start;
      align-items: center;
      flex-wrap: nowrap;
      flex-direction: row;
      align-content: flex-start;
      font-size: 14px;
      font-family: MicrosoftYaHei;
      font-weight: 400;
      color: #FFFFFF;
      width: 100px;
    }

    span {
      font-size: 14px;
      font-family: PingFang SC-Regular, PingFang SC;
      font-weight: 400;
      color: rgba(235, 255, 255, 1);
    }

    .dot {
      width: 8px;
      height: 8px;
      margin-right: 10px;
      flex-shrink: 0;
      border-radius: 50%;
    }

    .dot.disabled {
      background: rgba(#999, 0.8) !important;
    }

    span.disabled {
      color: rgba(#999, 0.8) !important;
    }

    .num {
      font-size: 22px;
      font-family: DIN-Bold;
      font-weight: 500;
      color: #FFFFFF;
    }
  }
}

.echartsBodys {
  width: 100%;
  position: relative;
  height: 100%;
  display: flex;
  justify-content: space-between;
  align-items: center;
  flex-wrap: nowrap;
  flex-direction: row;
  align-content: flex-start;
}

.echartsPage {
  width: 100%;
  position: relative;
  height: 100%;
  display: flex;
  justify-content: space-between;
  align-items: flex-start;
  flex-wrap: nowrap;
  flex-direction: column;
  align-content: flex-start;
}

.total {
  height: 50px;
  display: flex;
  justify-content: flex-start;
  align-items: center;
  flex-wrap: nowrap;
  flex-direction: row;
  align-content: flex-start;
  margin-left: 37px;
  font-size: 12px;
  font-family: MicrosoftYaHei;
  font-weight: 400;
  color: #FFFFFF;

  span {
    font-size: 26px;
    font-family: DIN-Bold;
    font-weight: 900;
    color: #FFFFFF;
    margin-left: 13px;
    text-shadow: 0 0 10px #2e99ec;
  }
}
</style>
更新
2024年01月31日
之前的效果是超过75%的都按照75%来算,但是客户对这一块追求比较精确,就算是95%也要能够看到95%的效果,所以这里我们改成实际进度乘以0.75来计算。


