标题代码
title: [{
  text: '64',
  left: 'center',
  y: '42%',
  textStyle: {
    fontSize: FontChart(26),
    fontWeight: '500',
    color: '#14a6f8',
    textAlign: 'center',
    fontFamily: 'DigitalDismay',
  },
}, {
  text: '总数量',
  left: 'center',
  top: '52%',
  textStyle: {
    fontSize: FontChart(14),
    fontWeight: '400',
    color: '#C7CFDC',
    textAlign: 'center',
    fontFamily: 'DigitalDismay',
  },
}]
完整代码
drawLine() {
window.addEventListener('resize', this.drawLine)
let myChart = this.$echarts.init(this.$refs.echarts1)
var colors = this.colorList
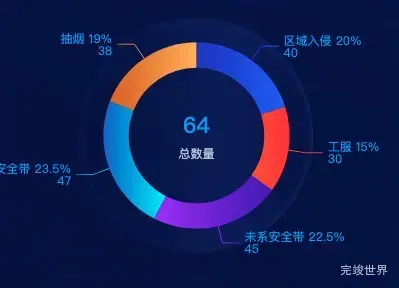
var data = [
{
name: '区域入侵',
value: 40
},
{
name: '工服',
value: 30
},
{
name: '未系安全带',
value: 45
},
{
name: '安全带',
value: 47
},
{
name: '抽烟',
value: 38
}
]
var colorList2 = ['rgba(20, 51, 204, 1)', 'rgba(212, 33, 1, 1)', 'rgba(164, 38, 255, 1)', 'rgba(0, 242, 254, 1)', 'rgba(219, 108, 18, 1)',]
var option = {
color: colors,
title: [{
text: '64',
left: 'center',
y: '42%',
textStyle: {
fontSize: FontChart(26),
fontWeight: '500',
color: '#14a6f8',
textAlign: 'center',
fontFamily: 'DigitalDismay',
},
}, {
text: '总数量',
left: 'center',
top: '52%',
textStyle: {
fontSize: FontChart(14),
fontWeight: '400',
color: '#C7CFDC',
textAlign: 'center',
fontFamily: 'DigitalDismay',
},
}],
legend: {
show: true,
orient: 'horizontal',
top: FontChart(0),
right: 'center',
itemGap: FontChart(20),
itemWidth: FontChart(20),
itemHeight: FontChart(14),
width: '100%',
textStyle: {
color: '#fff',
fontSize: FontChart(14)
}
},
tooltip: {
trigger: 'item',
formatter: '{a} {b} : {c} ({d}%)'
},
series: [
{
name: 'AI告警类型占比 (当日)',
type: 'pie',
radius: ['40%', '55%'],
center: ['50%', '50%'],
label: {
show: true,
normal: {
fontSize: FontChart(14),
color: 'rgba(0, 172, 255, 1)',
formatter: function (params) {
console.log(params)
return params.name + ' ' + params.percent + '%' + '\n' + params.value
}
}
},
labelLine: {
length: FontChart(20),
length2: FontChart(20)
},
data: data
},
]
}
myChart.clear()
myChart.resize()
myChart.setOption(option)
},