position
tooltip: {
show: true,
position: ['10%', '10%'],
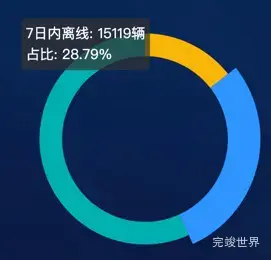
formatter: '{b0}: {c0}辆<br />占比: {d0}%'
},
drawLine () {
      var that = this
      window.addEventListener('resize', this.drawLine)
      const myChart = this.$echarts.init(this.$refs.echarts)
      var option = {
        tooltip: {
          show: true,
          position: ['10%', '10%'],
          formatter: '{b0}: {c0}辆<br />占比: {d0}%'
        },
        series: [
          {
            type: 'pie',
            center: ['50%', '50%'],
            radius: ['55%', '70%'],
            color: ['#F6B507', '#2A87F4', '#00AFAF'],
            labelLine: {
              show: false,
              normal: {
                length2: 0,
                length: 0,
              }
            },
            label: {
              normal: {
                formatter: '{b|{b}} \n {per|{d}%} ',
                borderColor: 'transparent',
                borderRadius: 2,
                show: false,
                rich: {
                  b: {
                    color: 'rgba(143, 178, 204, 1)',
                    fontSize: FontChart(18),
                    position: 'absolute',
                    top: 20,
                    left: 0,
                  },
                  per: {
                    color: 'rgba(51, 204, 255, 1)',
                    fontSize: FontChart(18),
                    padding: [0, 0, 5, -5]
                  }
                },
                textStyle: {
                  color: '#fff',
                  fontSize: FontChart(18)
                }
              }
            },
            data: [{
              name: '在线',
              value: that.running
            }, {
              name: '7日内离线',
              value: that.offline_7day
            }, {
              name: '7日内在线',
              value: that.online_7day
            }]
          }
        ]
      }
      myChart.clear()
      myChart.resize()
      myChart.setOption(option)
      clearInterval(that.inid)
      var app = {
        currentIndex: -1
      }
      that.inid = setInterval(function () {
        var dataLen = option.series[0].data.length
        // 取消之前高亮的图形
        myChart.dispatchAction({
          type: 'downplay',
          seriesIndex: 0,
          dataIndex: app.currentIndex
        })
        app.currentIndex = (app.currentIndex + 1) % dataLen
        // 高亮当前图形
        myChart.dispatchAction({
          type: 'highlight',
          seriesIndex: 0,
          dataIndex: app.currentIndex
        })
        // 显示 tooltip
        myChart.dispatchAction({
          type: 'showTip',
          seriesIndex: 0,
          dataIndex: app.currentIndex
        })
      }, 3000)
    }


