高德地图marker覆盖物自动轮播切换

echarts yekong 1757℃

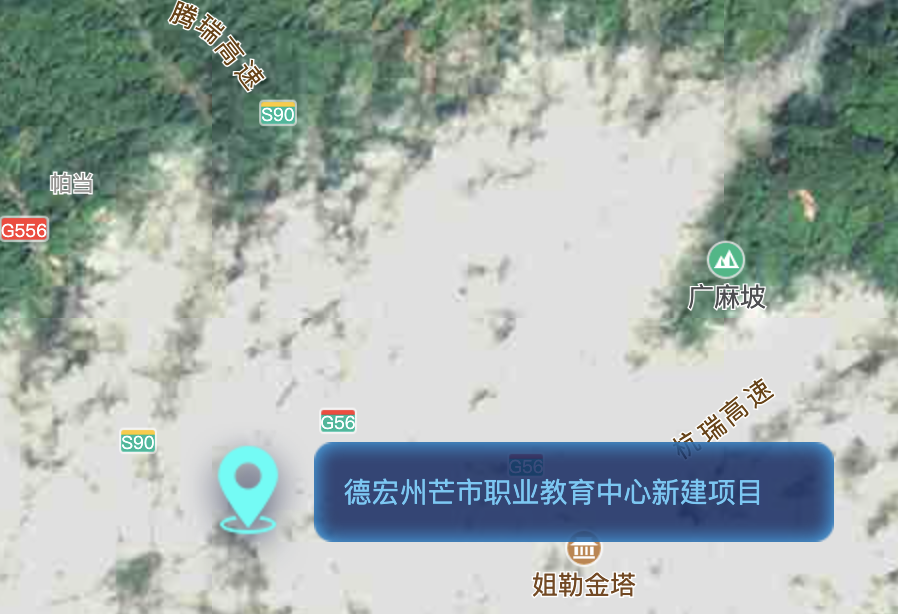
高德地图marker自动切换轮播,鼠标移上去轮播停止,鼠标移开轮播继续,点击marker显示弹窗
wanjunshijie 2021-04-18 at 08.03.42@2x
wanjunshijie 2021-04-18 at 08.04.13@2x
html

<div id="allmap" @mouseover="clearx2" @mouseleave="getmapswitch" class="allmap"></div>

js

clearx2() {
                clearInterval(this.timemap);
            },
            getmapswitch() {
                this.getmapqh();
            },
            getHeight() {
                var whei = $(window).width()
                $("html").css({fontSize: whei / 22});
                this.wheight = $(window).height() - 120;
                this.$nextTick(() => {
                    this.getmapx();
                })
            },
            getmapx() {
                var that = this;
                that.map = new AMap.Map('allmap', {
                    scrollWheel: true,
                    viewMode: '2D',
                    resizeEnable: true,
                    zoom: 13,
                    maxZoom: 30,
                    minZoom: 0,
                    center: [98.038763, 24.748133],
                });
                var satelliteLayer = new AMap.TileLayer.Satellite();
                that.map.add(satelliteLayer);
                var data_info = that.list3[that.activex2].list;
                for (var i = 0; i < data_info.length; i++) {
                    that.addMarker(data_info[i][0], data_info[i][1], data_info[i][2], 0)
                }
                that.getmapqh()
            },
            markerswitch() {
                var that = this;
                that.map.setZoomAndCenter(13, [that.list3[that.activex2].list[that.activexmap][0] + 0.03,
                    that.list3[that.activex2].list[that.activexmap][1]]);

                that.getclear();
                var data_info = that.list3[that.activex2].list;
                for (var i = 0; i < data_info.length; i++) {
                    if (that.activexmap === i) {
                        that.addMarker(data_info[i][0], data_info[i][1], data_info[i][2], 1)
                    } else {
                        that.addMarker(data_info[i][0], data_info[i][1], data_info[i][2], 0)
                    }
                }
                if (that.activexmap < that.list3[that.activex2].list.length - 1) {
                    that.activexmap += 1;
                } else {
                    that.activexmap = 0;
                }
            },
            getclear() {
                var that = this;
                let data = that.map.getAllOverlays();
                for (var i = 0; i < data.length; i++) {
                    that.map.remove(data[i])
                }
            },
            getmapqh() {
                var that = this;
                that.timemap = window.setInterval(() => {
                    setTimeout(() => {
                        that.markerswitch();
                    }, 0)
                }, 2000)
            },
            markerClick(e) {
                console.log(e)
                var that = this;
                that.getclear();
                var data_info = that.list3[that.activex2].list;
                for (var i = 0; i < data_info.length; i++) {
                    that.addMarker(data_info[i][0], data_info[i][1], data_info[i][2], 0)
                }
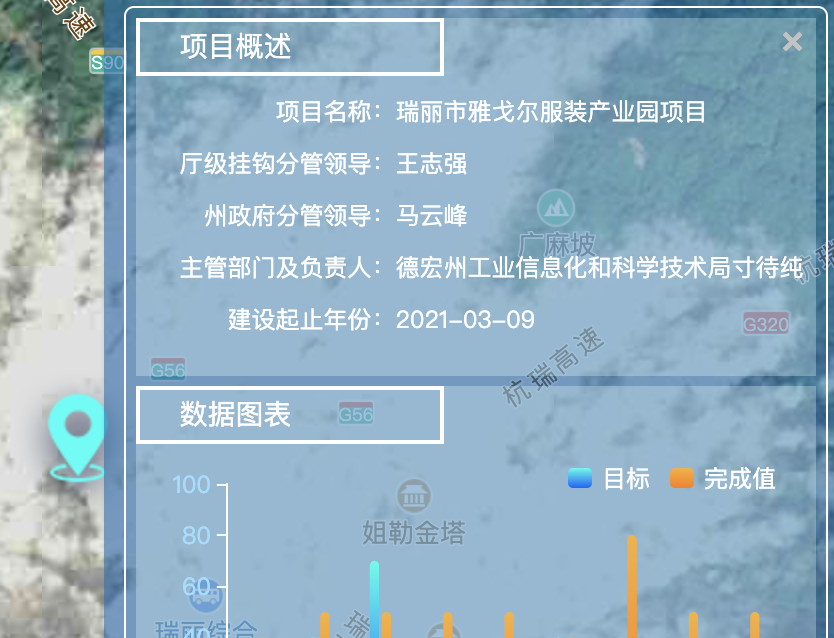
                var infoWindow = new AMap.InfoWindow({
                    anchor: 'middle-left',
                    content: "<div class=\"tanchuangMap\">\n" +
                        "        <div class=\"tanchuangMaptop\"></div>\n" +
                        "        <div class=\"tanchuangMaptop1\">\n" +
                        "            <div class=\"tanchuangMaptop1title\">\n" +
                        "                项目概述\n" +
                        "            </div>\n" +
                        "            <div class=\"tanchuangMaptop1body\">\n" +
                        "                <p><span>项目名称:</span>瑞丽市雅戈尔服装产业园项目</p>\n" +
                        "                <p><span>厅级挂钩分管领导:</span>王志强</p>\n" +
                        "                <p><span>州政府分管领导:</span>马云峰</p>\n" +
                        "                <p><span>主管部门及负责人:</span>德宏州工业信息化和科学技术局寸待纯</p>\n" +
                        "                <p><span>建设起止年份:</span>2021-03-09</p>\n" +
                        "            </div>\n" +
                        "        </div>\n" +
                        "        <div class=\"tanchuangMaptop1\">\n" +
                        "            <div class=\"tanchuangMaptop1title\">\n" +
                        "                数据图表\n" +
                        "            </div>\n" +
                        "            <div class=\"tanchuangMaptop1body\">\n" +
                        "                <div class=\"echartsmap\" id=\"echartsmap\">\n" +
                        "                </div>\n" +
                        "            </div>\n" +
                        "        </div>\n" +
                        "    </div>",
                });
                infoWindow.open(that.map, [e.lnglat.lng, e.lnglat.lat])
                setTimeout(() => {
                    that.echartsmap()
                }, 300)
            },
            echartsmap() {
                var echartsx = echarts.init(document.getElementById("echartsmap"));
                var option = {
                    tooltip: {
                        trigger: 'axis',
                        axisPointer: { // 坐标轴指示器,坐标轴触发有效
                            type: 'shadow' // 默认为直线,可选为:'line' | 'shadow'
                        }
                    },
                    grid: {
                        left: '4%',
                        right: '4%',
                        bottom: '10%',
                        top: '10%',
                        containLabel: true
                    },
                    legend: {
                        data: ['目标', '完成值'],
                        right: 10,
                        top: 0,
                        textStyle: {
                            color: "#fff"
                        },
                        itemWidth: 12,
                        itemHeight: 10,
                        // itemGap: 35
                    },
                    xAxis: {
                        type: 'category',
                        data: ['2020-4', '2020-5', '2020-6', '2020-7', '2020-8', '2020-9', '2020-10', '2020-11', '2020-12'],
                        axisLine: {
                            lineStyle: {
                                color: '#fff'
                            }
                        },
                        axisLabel: {
                            // interval: 0,
                            // rotate: 40,
                            textStyle: {
                                fontFamily: 'Microsoft YaHei',
                                color: '#98DEFF'
                            }
                        },
                    },

                    yAxis: {
                        type: 'value',
                        max: '100',
                        axisLine: {
                            show: true,
                            lineStyle: {
                                color: '#fff'
                            }
                        },
                        splitLine: {
                            show: false,
                            lineStyle: {
                                color: 'rgba(255,255,255,0.3)'
                            }
                        },
                        axisLabel: {
                            textStyle: {
                                fontFamily: 'Microsoft YaHei',
                                color: '#98DEFF'
                            }
                        }
                    },
                    series: [{
                        name: '目标',
                        type: 'bar',
                        barWidth: '15%',
                        itemStyle: {
                            normal: {
                                color: new echarts.graphic.LinearGradient(0, 0, 0, 1, [{
                                    offset: 0,
                                    color: '#00FFEA'
                                }, {
                                    offset: 1,
                                    color: '#0060FF'
                                }]),
                                barBorderRadius: 12,
                            },
                        },
                        data: [40, 40, 70, 30, 30, 40, 40, 30, 30, 30, 40, 40, 30, 30, 30,]
                    },
                        {
                            name: '完成值',
                            type: 'bar',
                            barWidth: '15%',
                            itemStyle: {
                                normal: {
                                    color: new echarts.graphic.LinearGradient(0, 0, 0, 1, [{
                                        offset: 0,
                                        color: '#F7B237'
                                    }, {
                                        offset: 1,
                                        color: '#FF7C04'
                                    }]),
                                    barBorderRadius: 11,
                                }

                            },
                            data: [40, 50, 50, 50, 50, 40, 80, 50, 50, 50, 70, 50, 50, 50, 50,]
                        },
                    ]
                };
                echartsx.clear();
                echartsx.resize();
                echartsx.setOption(
                    option
                );
            },
            addMarker(x, y, title, type) {
                marker = new AMap.Marker({
                    icon: "images/Markericon.png",
                    position: [x, y],
                    offset: new AMap.Pixel(-13, -30)
                });
                if (type === 0) {
                    marker.on('click', this.markerClick)
                    marker.setMap(this.map);
                } else {
                    marker.on('click', this.markerClick)
                    var markerContent = document.createElement("div");
                    var markerImg = document.createElement("img");
                    markerImg.className = "markerlnglat";
                    markerImg.src = "images/Markericon.png";
                    markerContent.appendChild(markerImg);
                    var markerSpan = document.createElement("span");
                    markerSpan.className = 'marker';
                    markerSpan.innerHTML = title;
                    markerContent.appendChild(markerSpan);
                    marker.setPosition([x, y]);
                    marker.setContent(markerContent);
                    marker.setMap(this.map);
                }
            },

实例下载

实例下载

喜欢 (3)